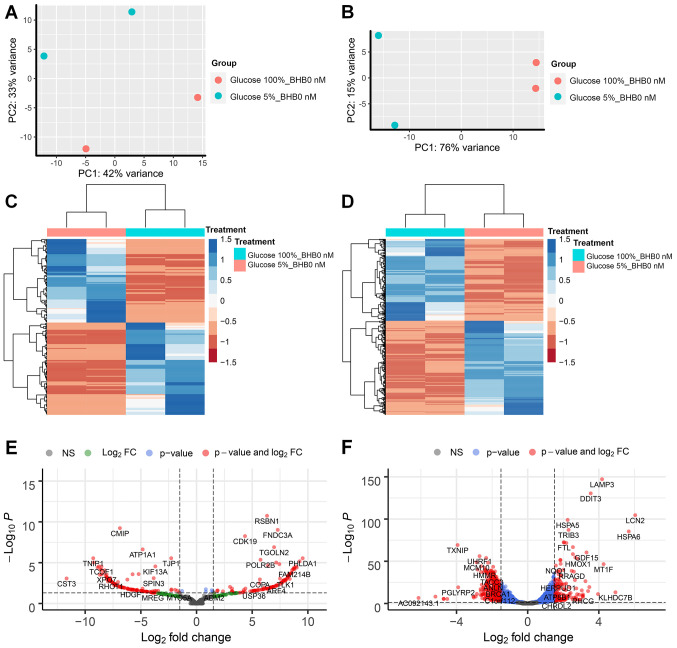
Figure 2.
RNA sequencing analysis of MCF-7 and T47D breast cancer cells after glucose deprivation. Principle component analysis of (A) MCF-7 cells and (B) T47D) cells. Unsupervised clustering analysis and heatmap of differentially expressed genes in (C) MCF-7 and (D) T47D cells after glucose deprivation. Volcano plot of differentially expressed genes in (E) MCF-7 cells and (F) T47D cells. Vertical dotted lines indicate borders for genes with 1.5-fold expression change; horizontal dotted line indicates P-value of 0.05. BHB, β-hydroxybutyrate.

