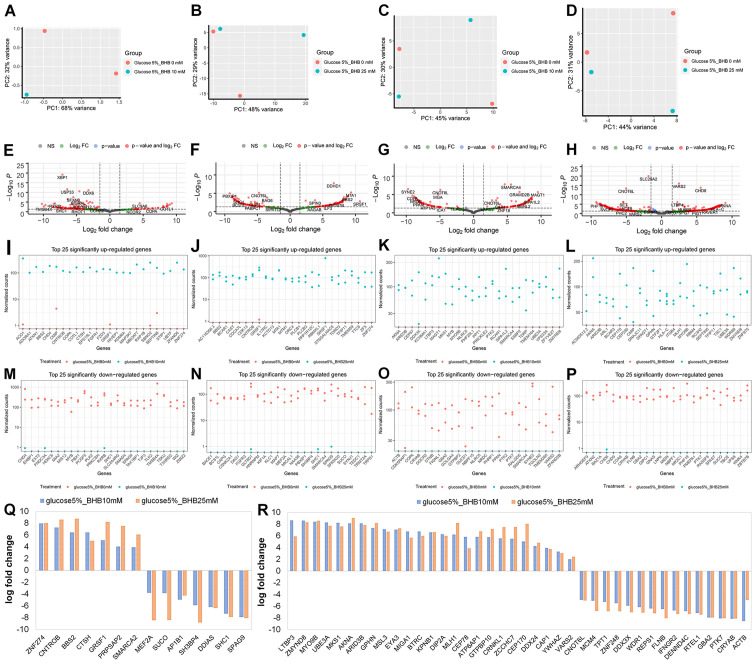
Figure 3.
RNA sequencing analysis after 10 mM BHB or 25 mM BHB treatment of glucose deprived MCF-7 and T47D breast cancer cells. Principle component analysis of (A and B) MCF-7 cells and (C and D) T47D cells treated with (A and C) 10 mM BHB or (B and D) 25 mM BHB compared to cells treated with 225 mg/l glucose. Volcano plot of differentially expressed genes in (E and F) MCF-7 cells and (G and H) T47D cells treated with (E and G) 10 mM BHB or (F and H) 25 mM BHB compared to cells treated with 225 mg/l glucose. Vertical dotted lines indicate borders for genes with 1.5-fold expression change; horizontal dotted line indicates P-value of 0.05. Highest fold change of differentially expressed genes in (I, J, M and N) MCF-7 cells and (K, L, O and P) T47D cells treated with (I, K, M and O) 10 mM BHB and (J, L, N and P) 25 mM BHB compared to cells treated with 225 mg/l glucose; Graphs are separates by (I-L) significantly upregulated or (M-P) significantly downregulated gene expression. Genes that are significantly differentially expressed in (Q) MCF-7 cells and (R) T47D cells in both 10 mM BHB and 25 mM BHB treatments. BHB, β-hydroxybutyrate.

