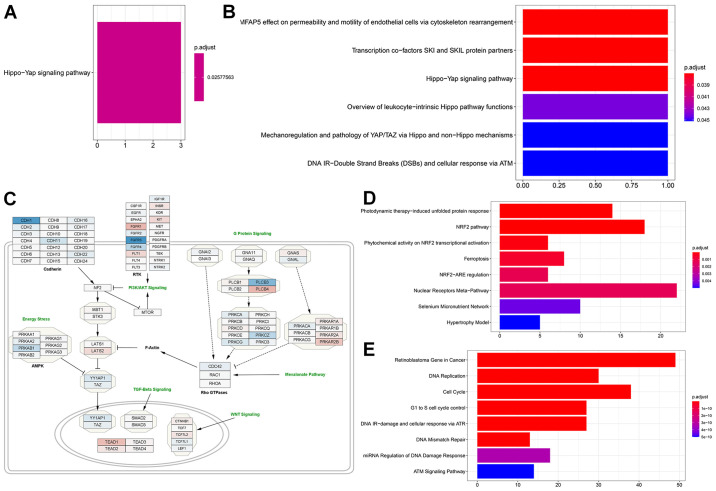
Figure 4.
Gene ontology, over representation analysis and pathway enrichment analysis. (A) MCF-7 cells enrichment after glucose deprivation and (B) after treatment with 10 mM BHB compared to cells treated with 225 mg/l glucose alone. (C) WikiPathways regulating Hippo signaling (WP4540) overlaid with fold-change differentially expressed genes in MCF-7 cells after glucose deprivation compared to cells grown with 4.5 g/l glucose (blue, downregulation; red, upregulation). (D) Over representation analysis results for significantly higher expressed genes in T47D cells after glucose deprivation and (E) for significantly lower expressed genes. BHB, β-hydroxybutyrate.

