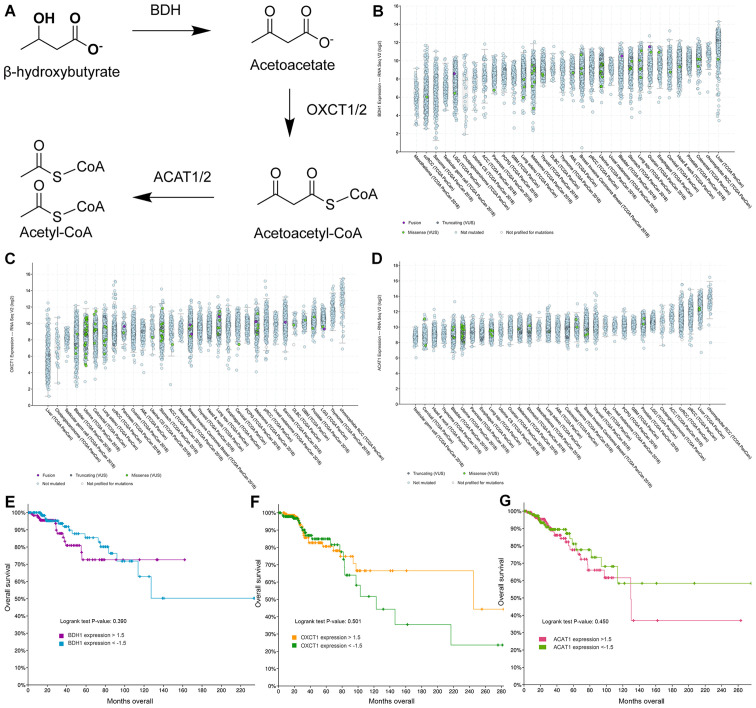
Figure 6.
Expression of enzymes responsible for catabolic metabolism of ketone bodies in cancer patient samples. (A) Schematic overview of catabolism of ketone bodies BHB and acetoacetate in neural and peripheral tissues. (B-D) Log2-fold gene expression in 32 different cancer sites of (B) BDH1, (C) OXCT1, and (D) ACAT1. Each dot represents the expression level of a single patient. Colors represent gene or chromosomal mutations as labelled in each figure. Cancer studies are ordered by median expression within each study. A total of 10,953 patient samples are represented in these graphs. (E-G) Gene expression levels of above 1.5-fold or below −1.5-fold change based on mRNA expression z-scores relative to all samples are represented from breast cancer patients only and plotted against overall survival for (E) BDH1, (F) OXCT1 and (G) ACAT1.

