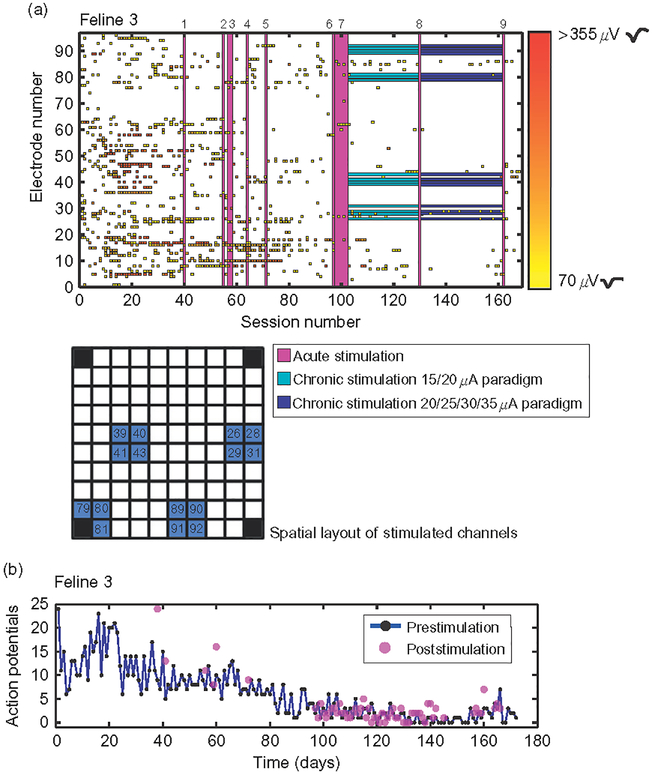
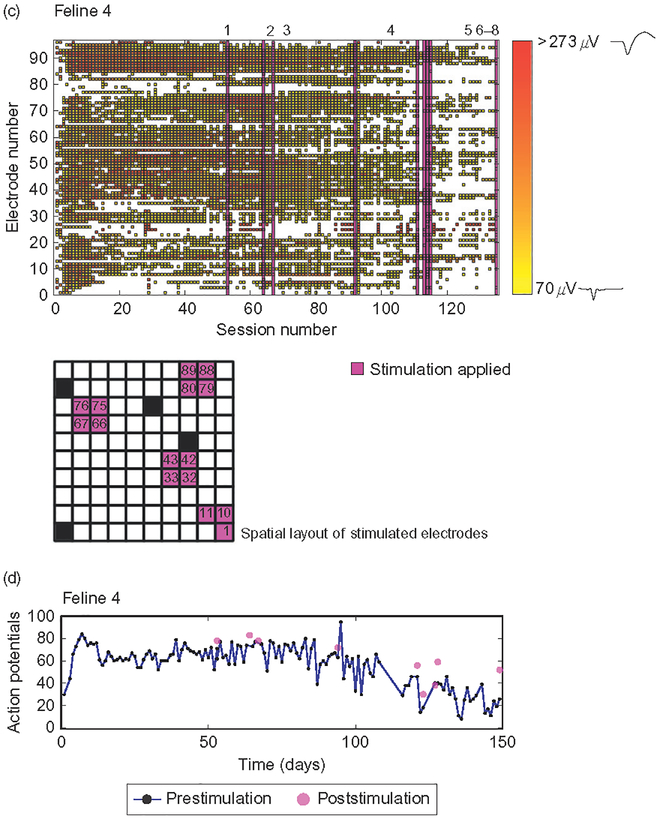
Fig. 5.
Microstimulation did not have a clear effect on the number or distribution of action potentials across the array over chronic timescales. (a and c) Raster of action potentials in Felines 3 and 4, color coded by amplitude over recording sessions. Purple bars represent an acute stimulation session, detailed by number in Table 2. Teal bars in Feline 3 represent chronic stimulation at the low stimulation paradigm listed in Table 2, while blue bars represent the high stimulation paradigm applied to the 15 electrodes highlighted. Grids show the spatial layout of electrodes stimulated, blue in Feline 3 and purple in Feline 4. Waveforms shown on color bar are samples of action potential shapes isolated at low and high amplitudes. (b, d) Number of action potentials recorded both over time before (blue) and after (purple) microstimulation in Felines 3 and 4. While the number of action potentials overall did decrease significantly by the end of the experiment in both felines (p<0.01, Student’s t-test), the number of action potentials isolated acutely, that is, before and after individual stimulation sessions, did not decrease (p<0.05, Student’s t-test).


