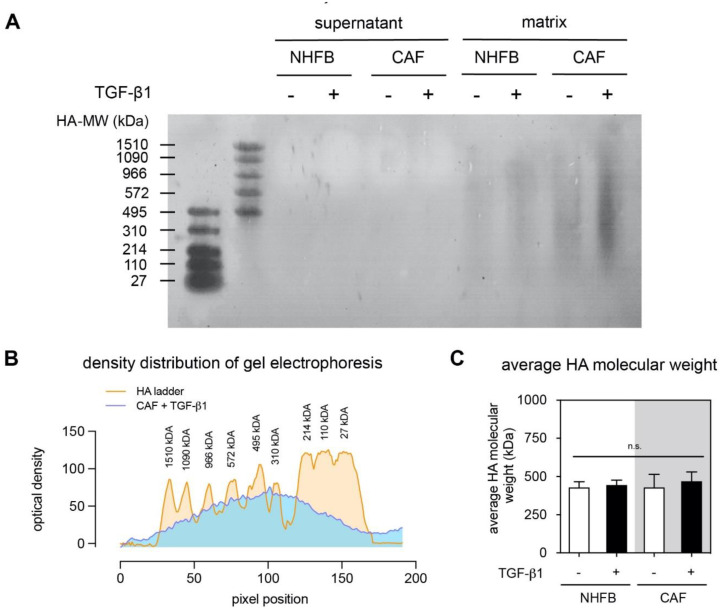
Figure 4.
Analysis of HA molecular weight. (A) Representative images of electrophoresis gel of supernatant and soluble decellularized collagen matrices of FB and CAF in dependence of TGF-β1. (B) Representative density profile plot of molecular weight distribution of matrix bound HA of CAF treated with TGF-β1. (C) Analysis of the average HA molecular weight of decellularized matrices. Data are presence as mean ± SD; n.s.—not significant. All quantitative experiments were performed at least in 3 replicates with fibroblasts and CAF from 3 different donors for each condition.

