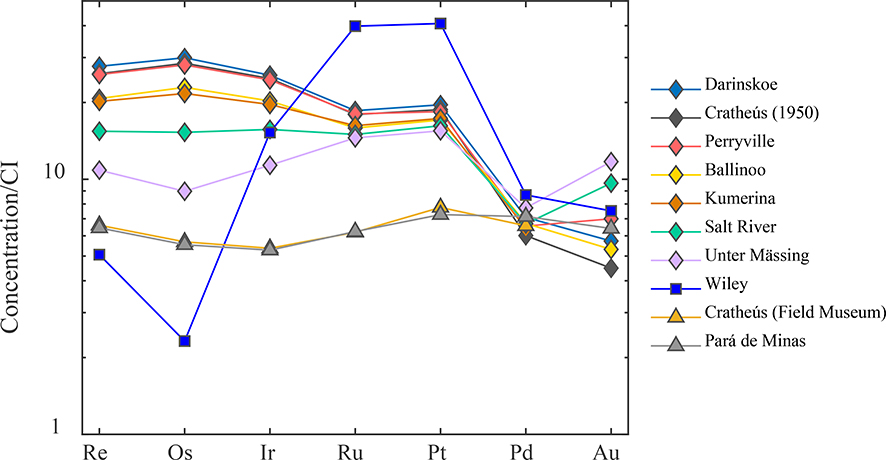
Figure 2.
Bulk CI chondrite normalized abundance plot of HSE abundances. Data for all HSE except Au were obtained by isotope dilution for bulk samples of the IIC irons, Cratheús (Field Museum) and Pará de Minas (IVA iron). The Au data were obtained by laser ablation ICP-MS. The pattern for Wiley is considerably different from the other IIC irons and inconsistent with it being a IIC iron. Bulk composition data were normalized to Re, Os, Ir, Ru, Pt and Pd concentrations for the CI chondrite Orgueil reported by Horan et al. (2003) and Au data were normalized to average Au concentrations of CI chondrites reported by Fischer-Gödde et al. (2010).

