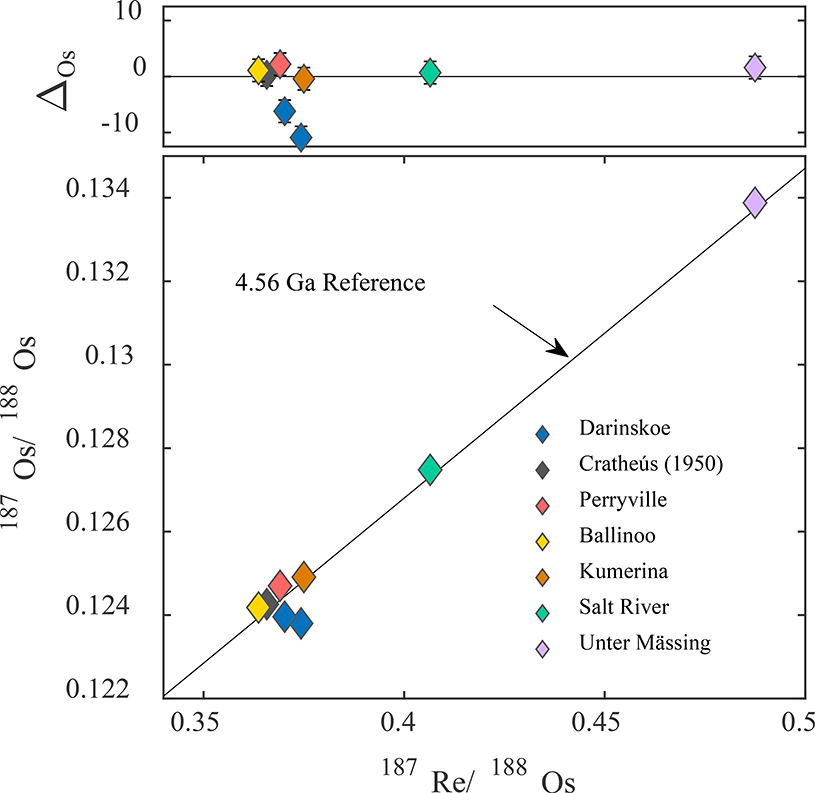
Figure 3.
187Re/188Os versus 187Os/188Os isochron diagram for group IIC iron meteorites. Symbols in lower figure are larger than error bars. Upper figure shows 187Re/188Os versus Δ values (parts per 10,000 deviation from the IIC isochron). The error bars represent the total analytical uncertainties (2σ). Data are shown relative to a 4.56 Ga reference isochron.

