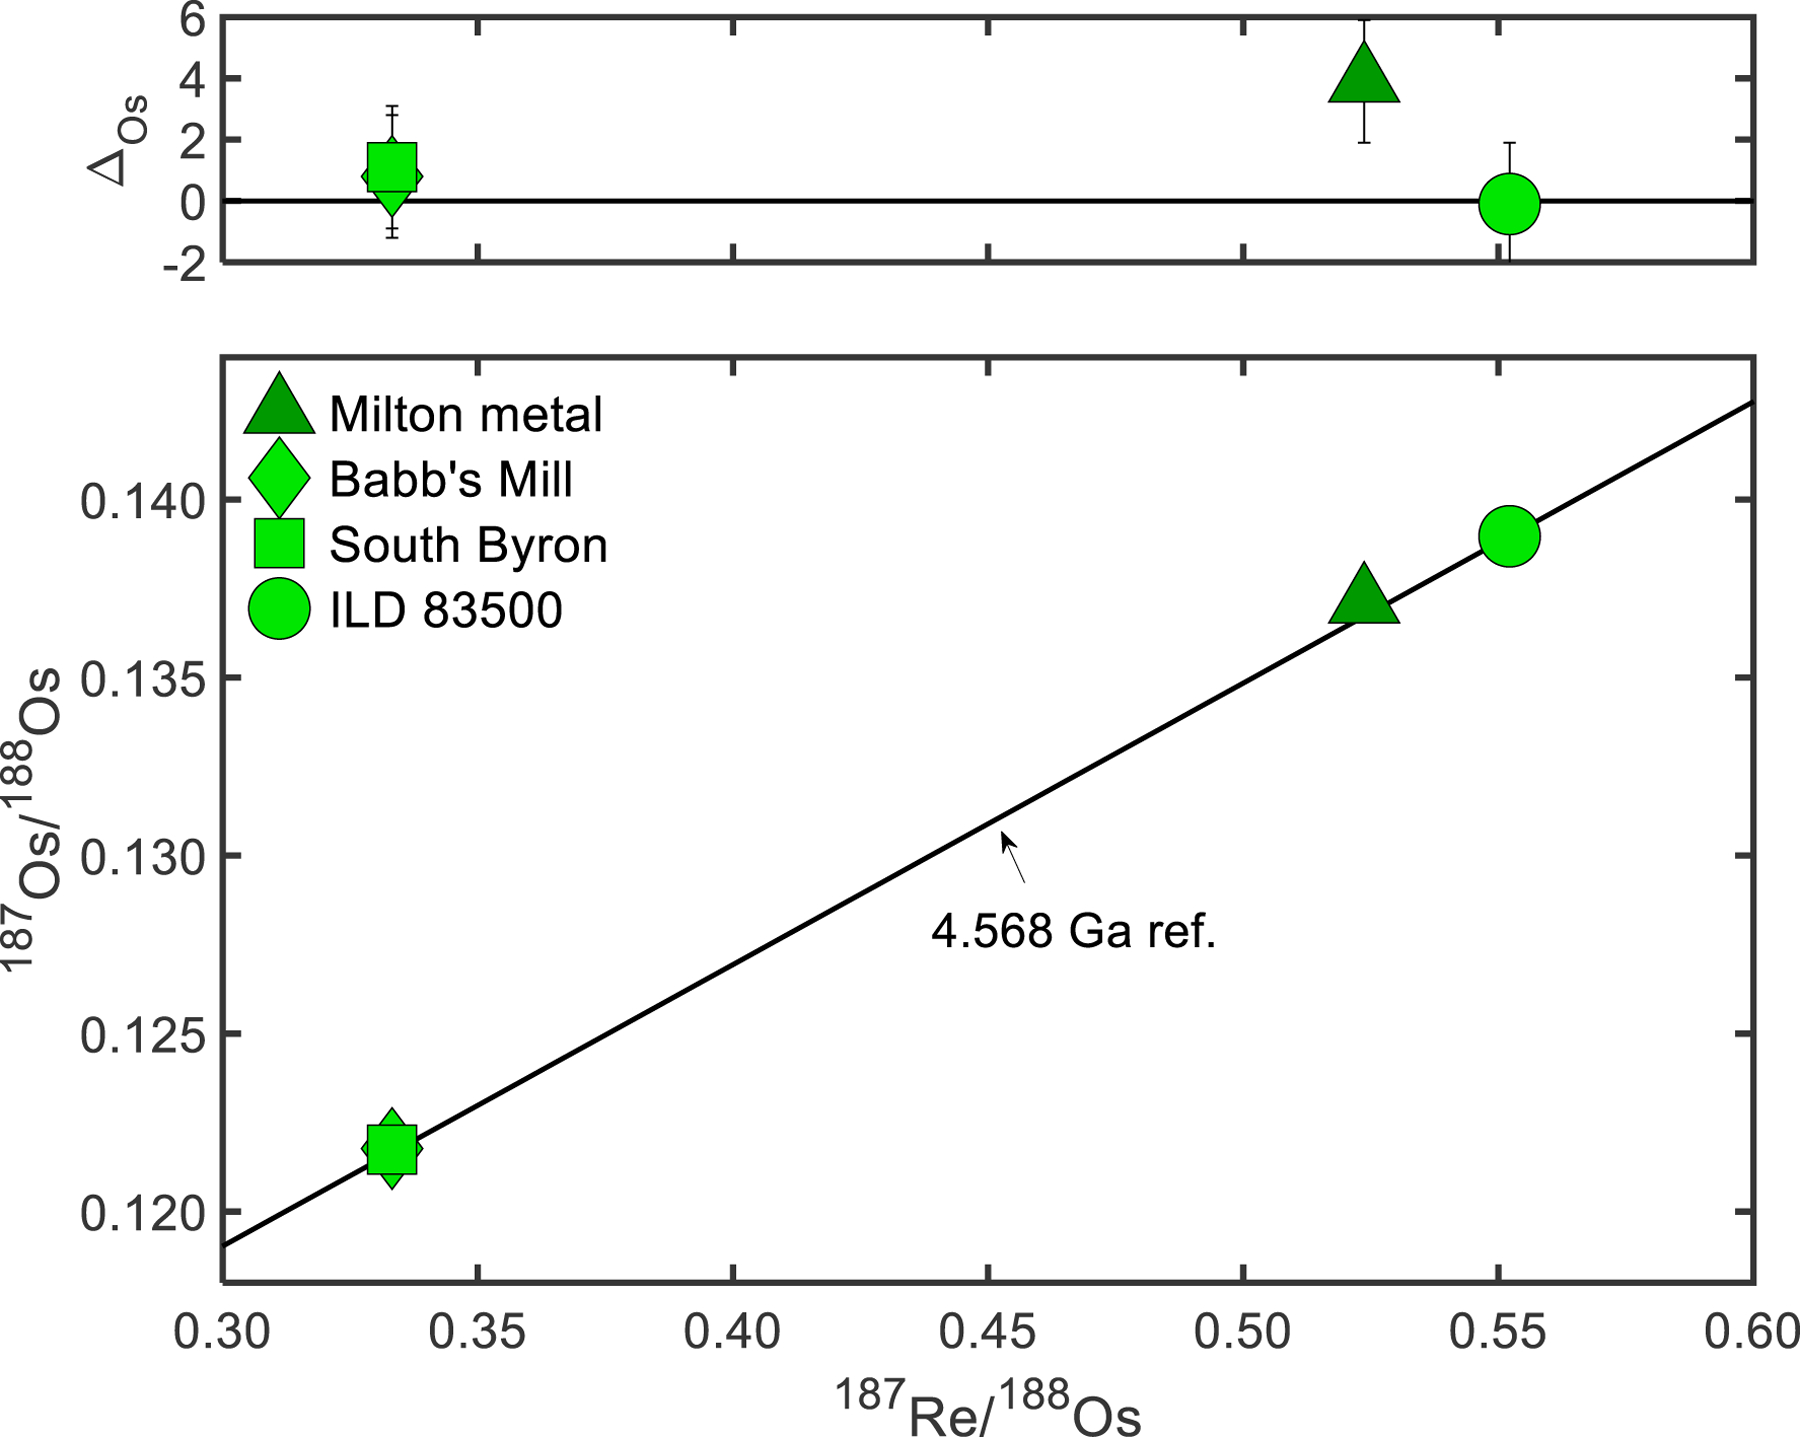
Fig. 2.

(Top) 187Re/188Os vs. ΔOs plot for the Milton metal and SBT, where ΔOs is the parts per 10,000 deviation of the 187Os/188Os ratio of a sample from a 4.568 Ga reference line. (Bottom) 187Re/188Os vs. 187Os/188Os plot for the Milton metal and SBT. Reference line represents the 4.568 Ga hypothetical evolution of the 187Os/188Os ratio in chondrites, assuming an initial 187Os/188Os = 0.09531, present day chondritic 187Os/188Os = 0.1270 and 187Re/188Os = 0.40186, and λ = 1.666 × 10⁻¹¹ yr−1 (Smoliar et al.,1996; Shirey and Walker, 1998).
