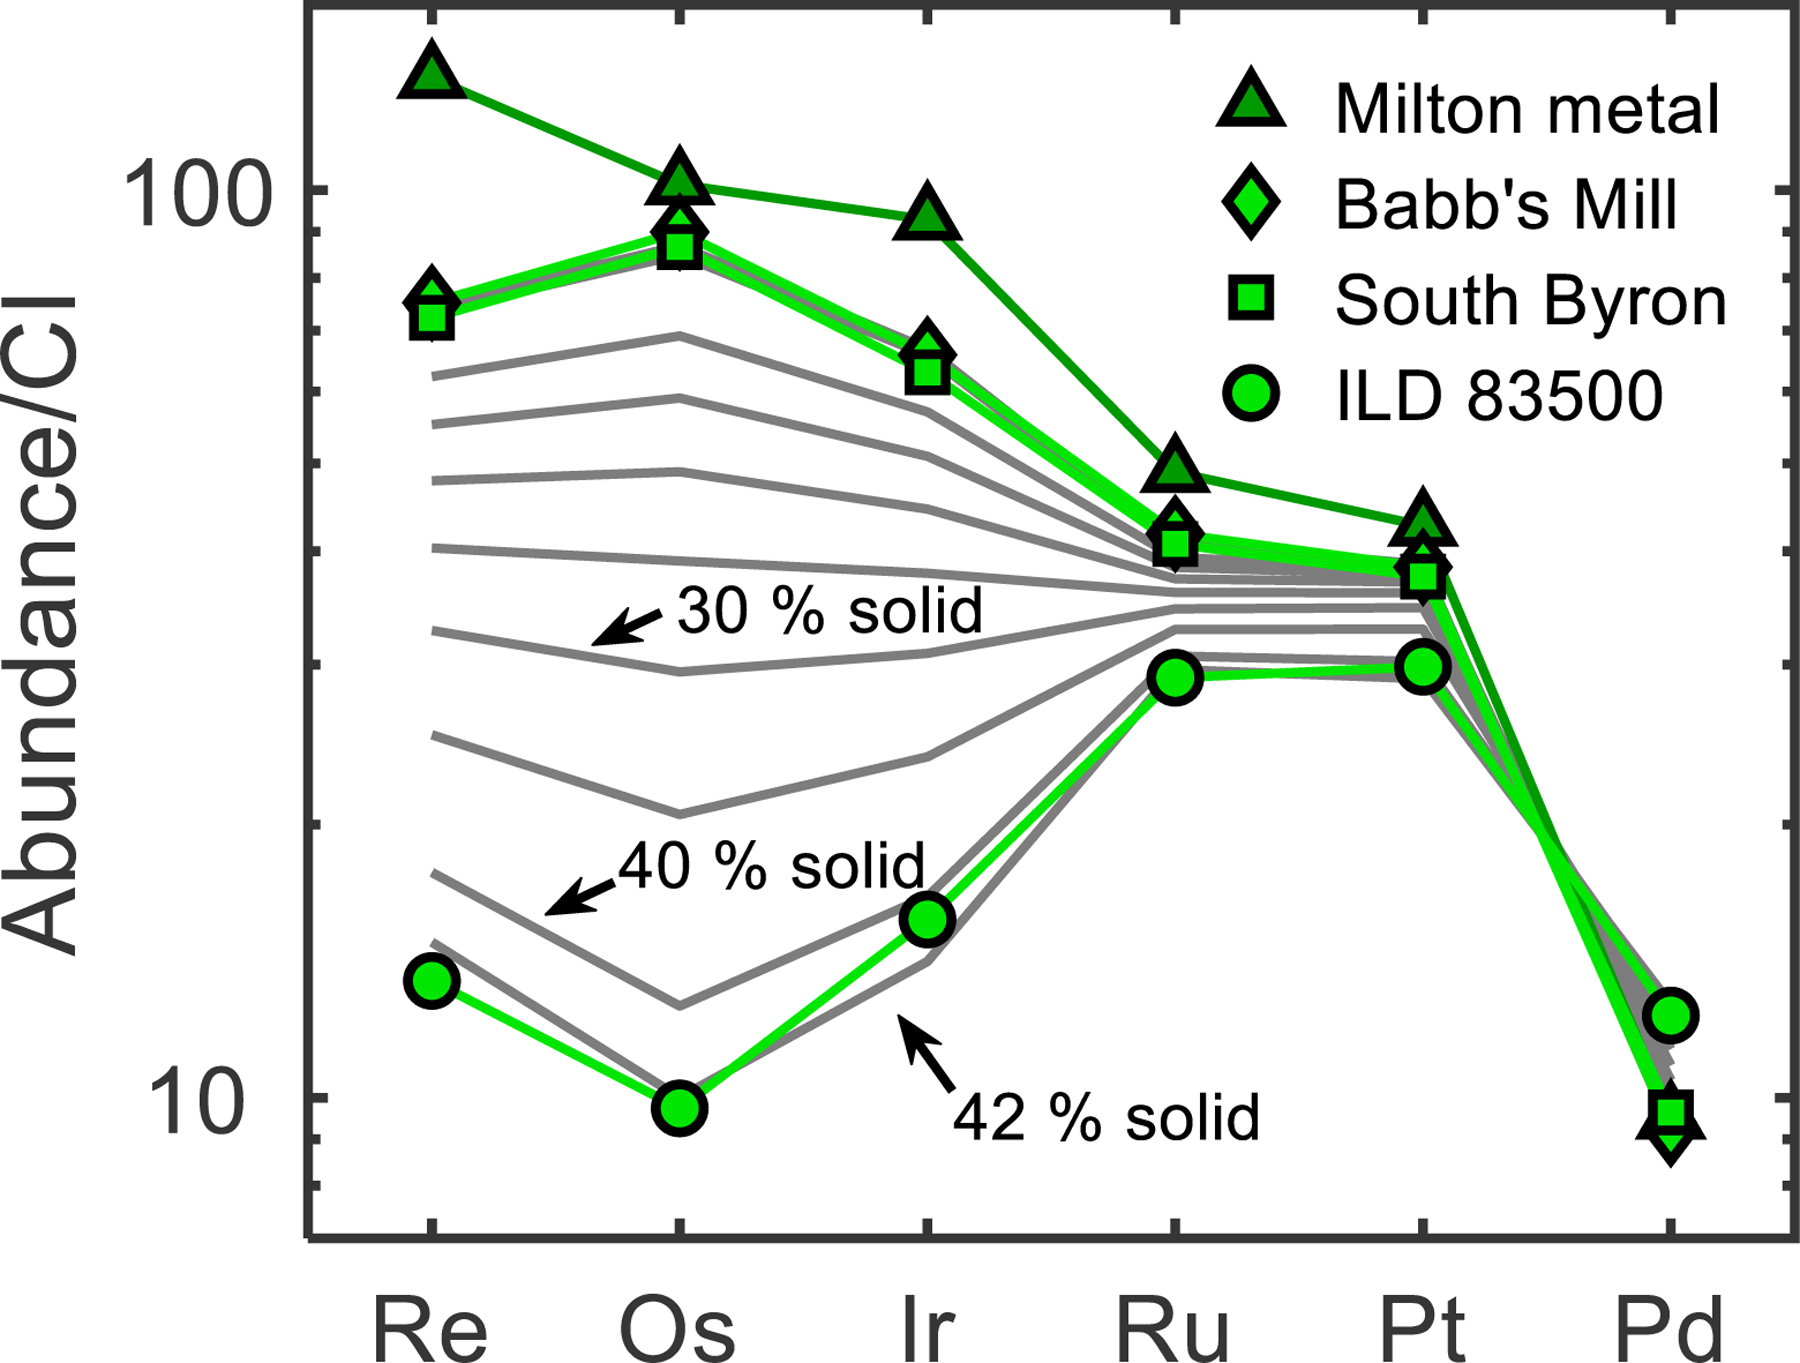
Fig. 4.

CI-chondrite normalized HSE contents of Milton and the SBT, and HSE abundance results of a fractional crystallization model (grey lines). Babb’s Mill, South Byron and ILD 83500 match 1 %, 2 %, and 42 % metal crystallization in this model, respectively. Model results are shown for 10 % to 40 % solid in 5 % increments, as well as the 1 %, 2 %, and 42 % model matches to the SBT. Model results for 1 % and 2 % are covered by patterns for Babb’s Mill and South Byron.
