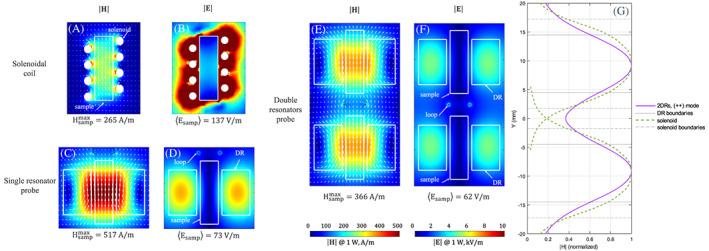
FIGURE 3.

Electromagnetic field (modulus) maps from numerical simulations (CST Studio) for 1 Watt of input power (impedance matched case). Left, top: (a) H‐field and (b) E‐field of the solenoid; left, bottom: (c) H‐field and (d) E‐field of the single dielectric ring resonator probe. Right: (e) H‐field and (f) E‐field of the dual dielectric ring resonators probe. In each case, the probe contains one (or two) saline water sample(s) of diameter 4 mm, height 14 mm, conductivity 1.59 S/m and relative permittivity 81. The maximum value of magnetic field reached in the sample and the mean value of the electric field in this region are given for comparison. White arrows represent the magnetic field lines. The graph on the right (g) represents the H‐field magnitude profiles, extracted from the magnetic field maps, along the resonator axis and in its centre, for comparison of the (++) coupled mode with the solenoid coil. To this end, the solenoid field profile is represented twice, at the location of each of the coupled DRs
