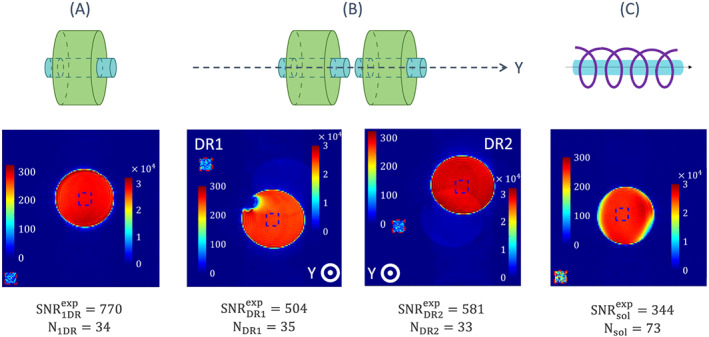
FIGURE 5.

Experimental SNR investigation. SNR maps of (a) a single ceramic probe, (b) a dual ceramic probe and (c) the optimal solenoid. The signal and noise boxes are represented in blue and red dashed contours, respectively, with their own color scale. The signal value is computed from the mean value of the pixels in the signal box, within the sample, and the noise from the standard deviation of the noise box located outside the sample, as shown on each slice. The numerical values of the noise level and the SNR are given below each figure. The sample is a saline water tube of relative permittivity 81 and electrical conductivity 1.59 S/m in this range of frequencies. In the left map of (b), the low signal region within the tube is an air bubble
