
Figure 4.
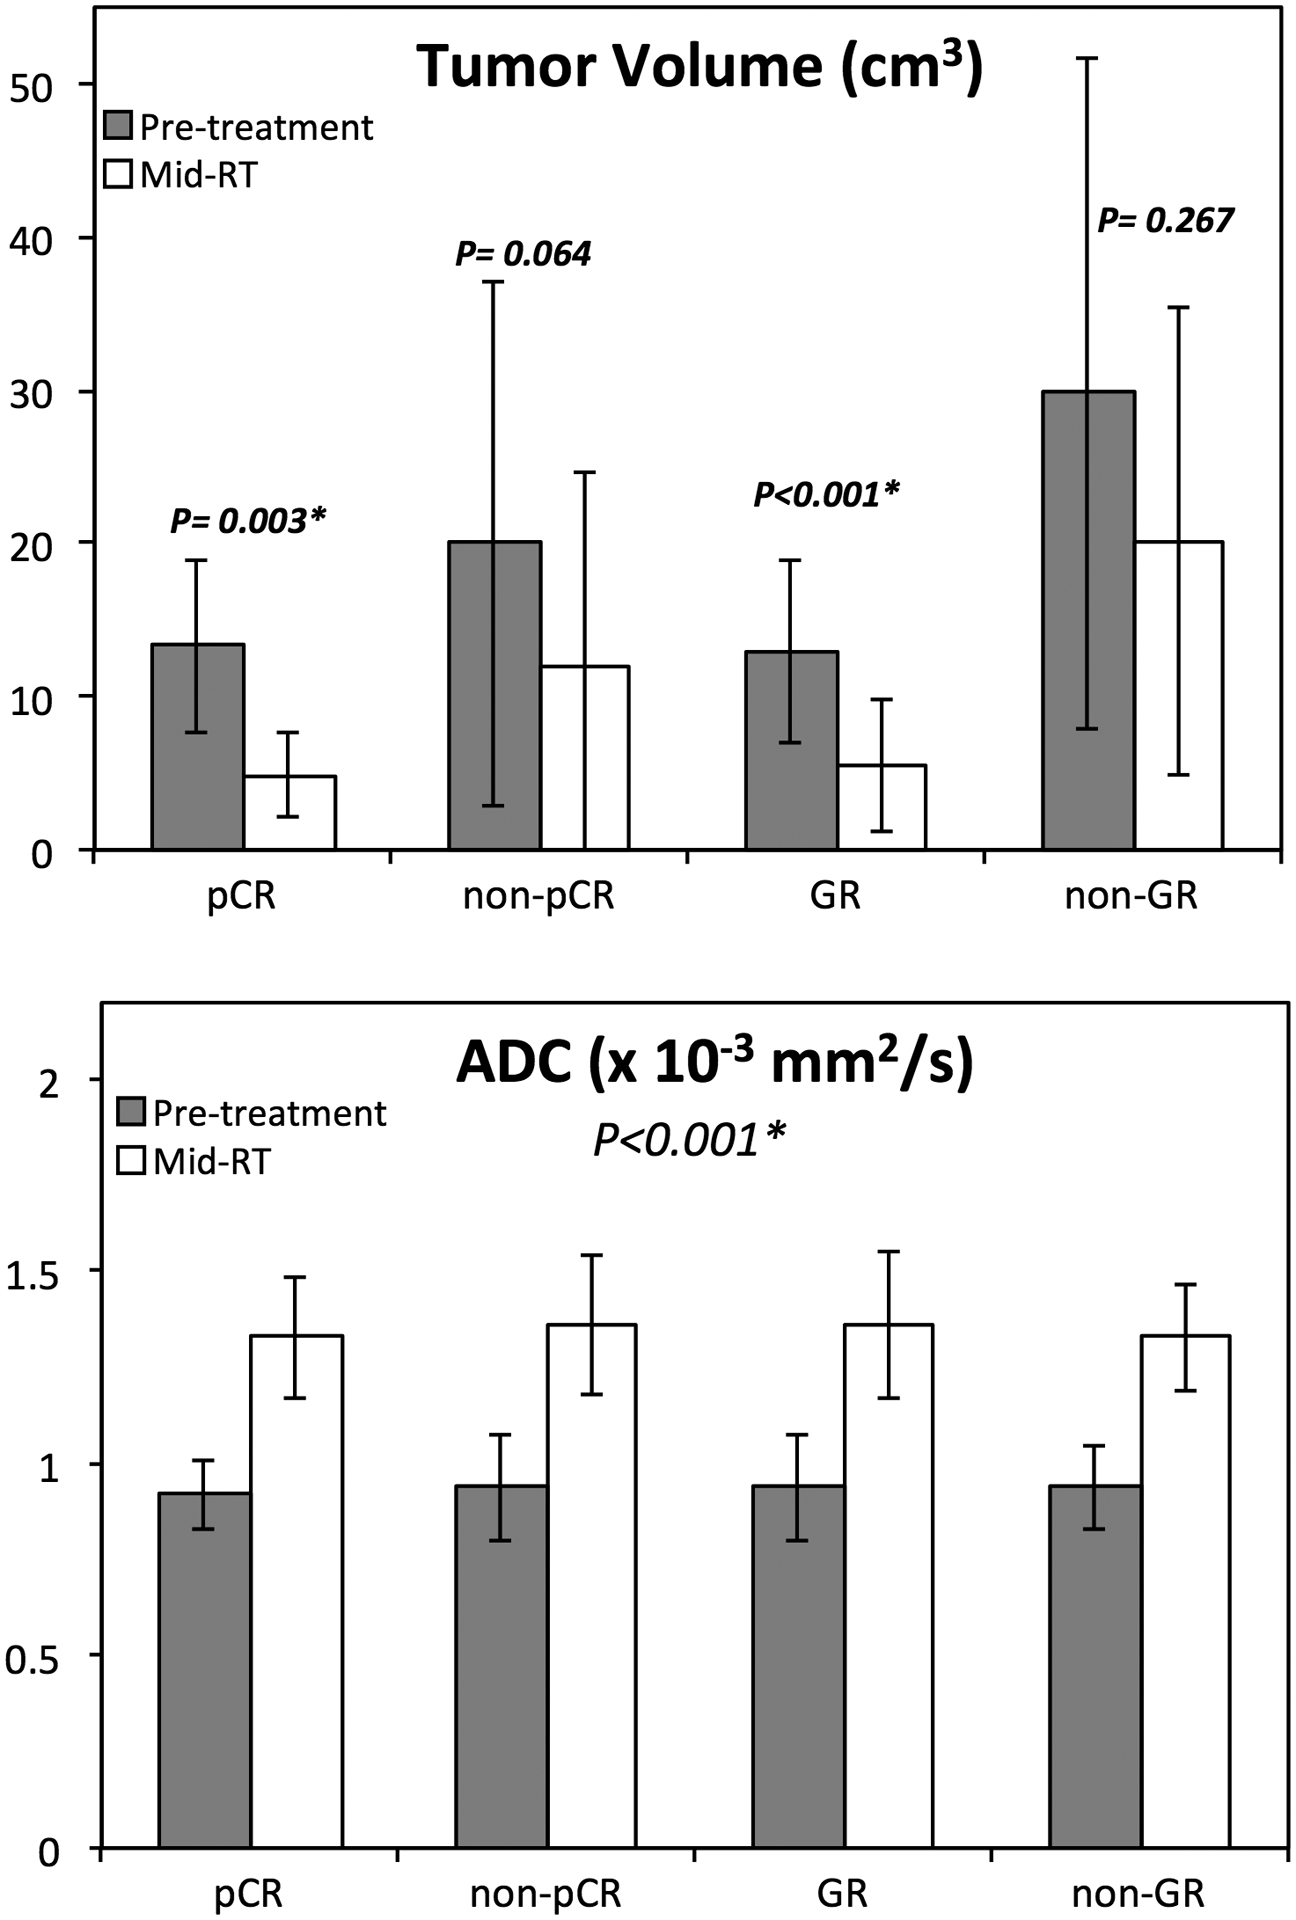
Bar plots showing differences of tumor volume and ADC between the pre-treatment (grey) and the mid-RT (white) in 4 response groups. The tumor volume decreases in mid-RT follow-up compared to the pre-treatment MRI is significant for the pCR and GR groups. The ADC increases in the mid-RT MRI compared to the pre-treatment MRI, and significant in all 4 groups.