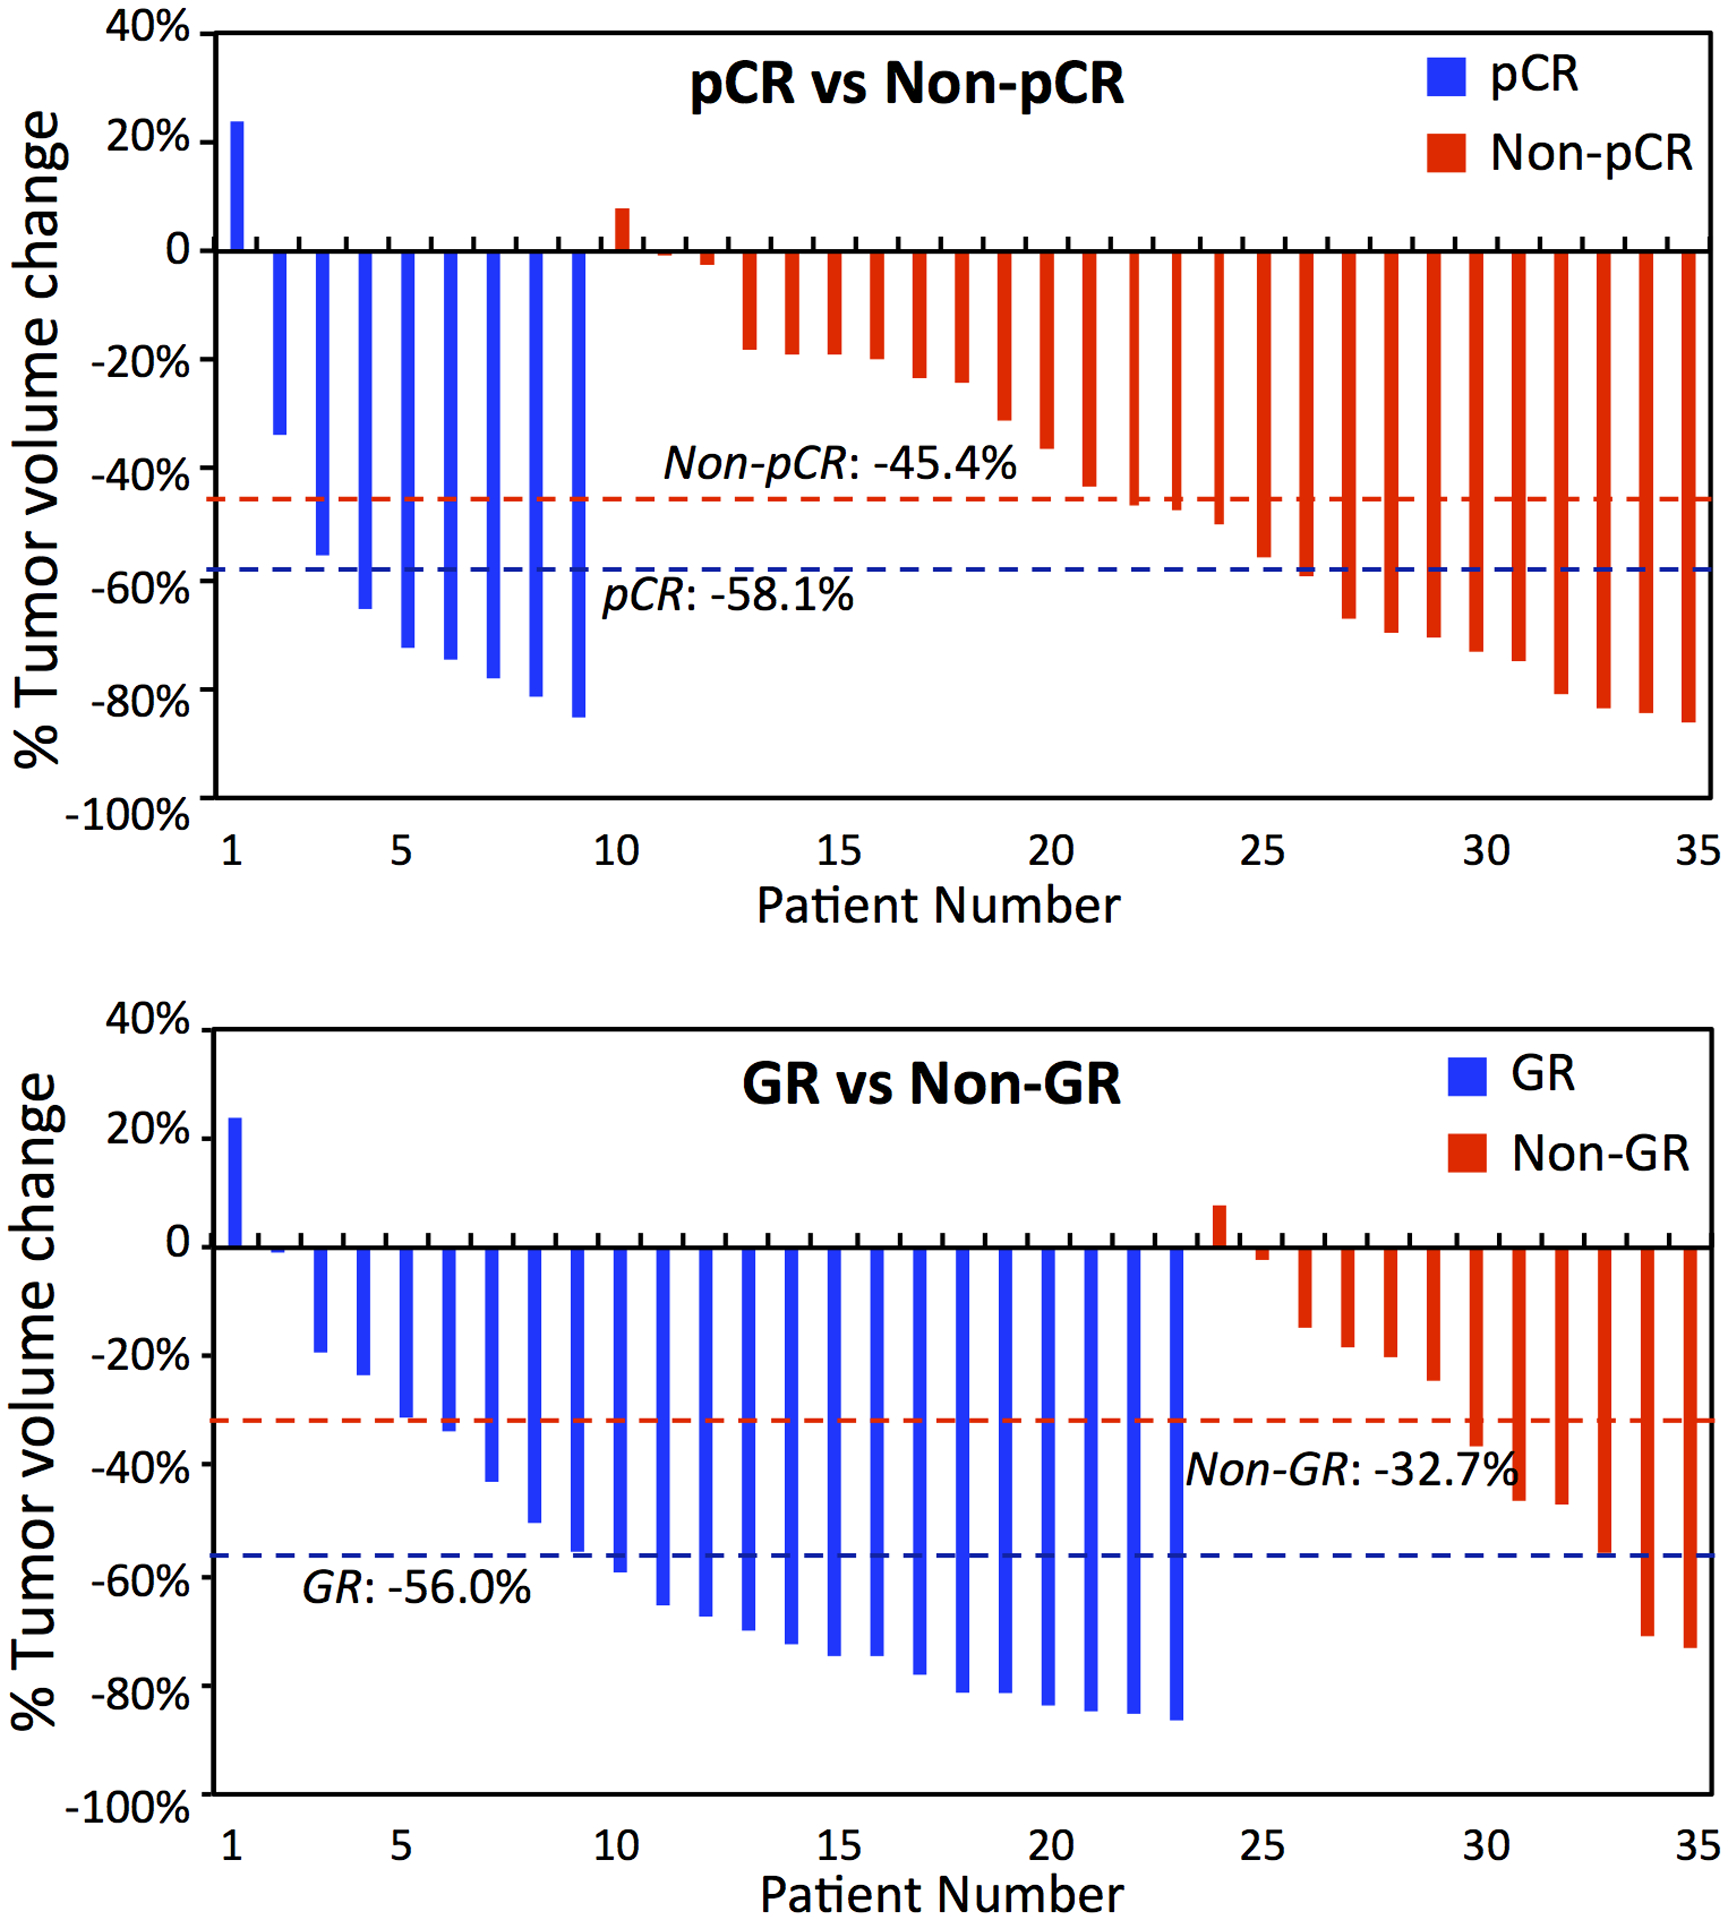
Figure 5.

Waterfall plots of percent change in tumor volume of 35 patients who have both pre-treatment and mid-RT follow-up MRI. Top: Plot of pCR vs. non-pCR patients with mean change of −58.1% vs. −45.4% (p=0.28). Bottom: Plot of GR vs. non-GR with the mean change of −56.0% vs. −32.7% (p=0.03).
