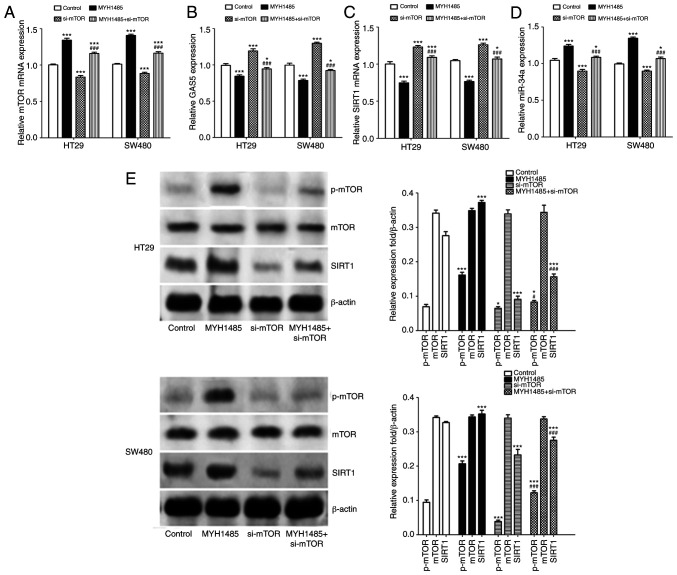
Figure 6.
mTOR/SIRT1 pathway inhibits expression of GAS5 and forms a negative regulatory feedback loop with miR-34a in CRC HT29 and SW480 cells. (A-D) CRC cells were treated with MYH1485 with or without si-mTOR transfection, and then RT-qPCR was used to analysis mTOR mRNA, GAS5, SIRT1 mRNA and miR-34a expression. (E) Western blotting shows expression of p-mTOR, mTOR and SIRT1 in CRC cells. Quantification of the results was performed. *P<0.05, ***P<0.001 means a significant difference vs. the control group; #P<0.05, ###P<0.001 means a significant difference vs. the si-mTOR treatment group. GAS5, growth arrest specific 5; CRC, colorectal cancer; SIRT1, sirtuin 1; mTOR, mammalian target of rapamycin; p-, phosphorylated.

