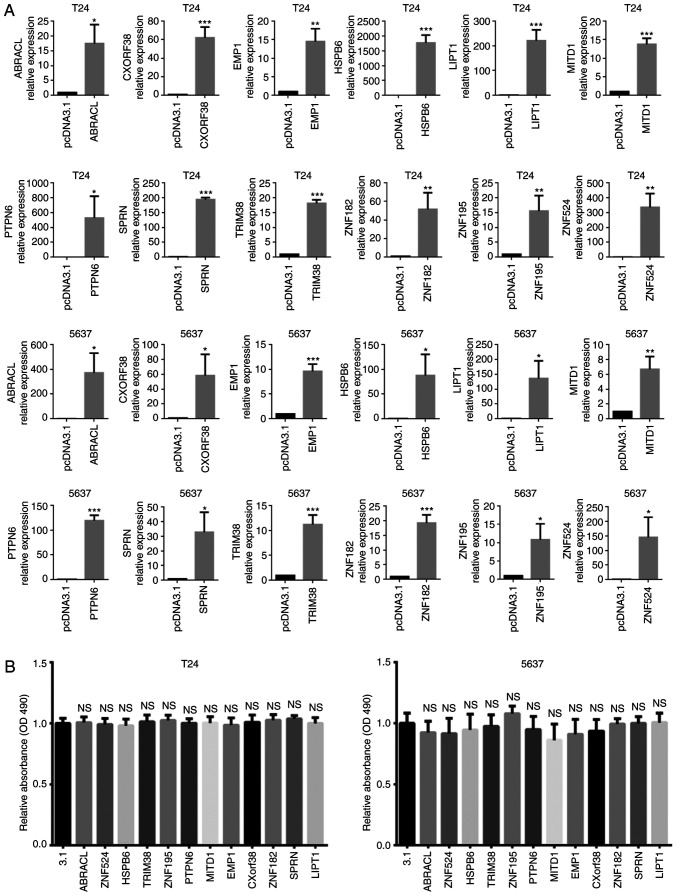
Figure 2.
Effects of the prognostic genes overexpression on cell viability of bladder cancer cells in vitro. (A) The effects of overexpression were validated via reverse transcription-quantitative PCR. (B) The results of the MTT assay. The cells and the gene expression vectors used for transfection were indicated in the figure. All experiments were repeated at least for three times. The data are presented as the mean ± standard deviation. *P<0.05; **P<0.01; ***P<0.001 vs. control group (pcDNA3.1). NS, no significance; MITD1, MIT-domain containing protein 1; 3.1, pcDNA3.1+ vector.

