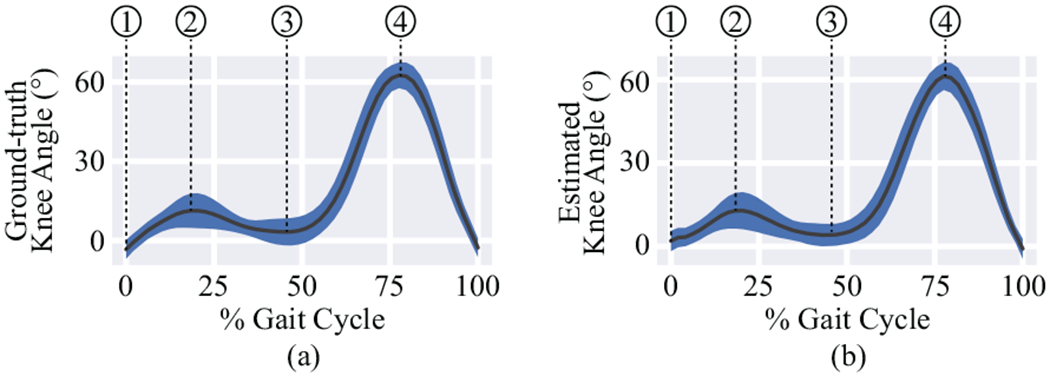
Fig. 5.

Comparison of a) ground truth gait cycles and b) gait cycles estimated from sensor readings. The solid line is the mean knee angle and the shaded area represents one standard deviation. Four important kinematic parameters during gait are annotated in the figures: 1) the knee flexion/extension angle at the heel strike, 2) the peak flexion angle during the stance phase, 3) the knee flexion/extension angle at the toe-off, and 4) the peak flexion angle during the swing phase.
