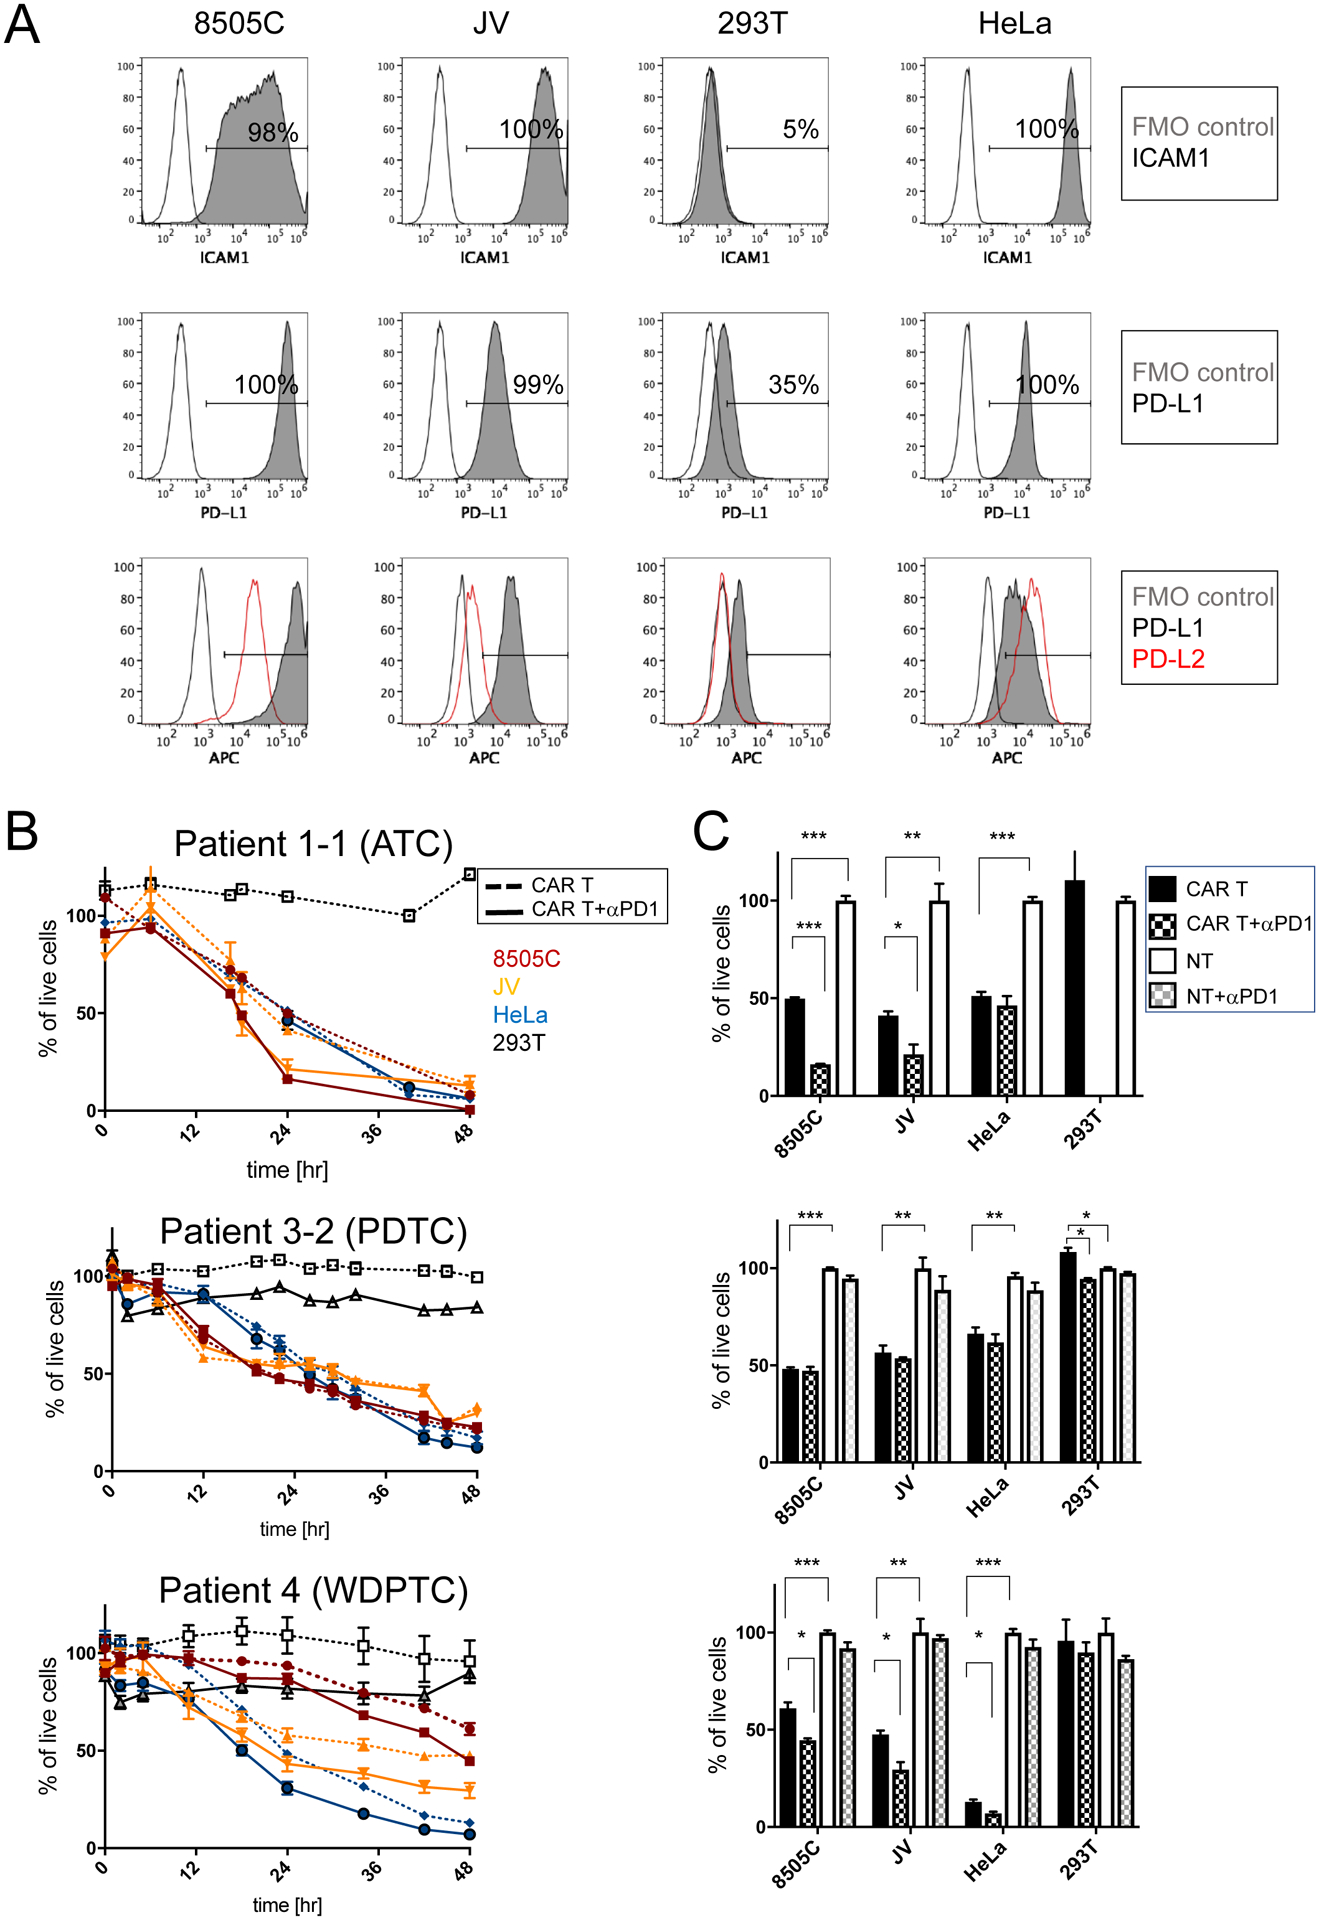
Figure 3. Inhibition of PD1 leads to increased target cell killing by ICAM1-CAR T cells in vitro independent of PD1 expression levels.

(A) Representative flow cytometry plots of ATC cell lines 8505C and JV, and 293T and HeLa control cell lines, which are stained for ICAM1 (first row) and PD-L1 (second row) antibodies. FMO control and antibody-stained plots are indicated by unfilled and gray solid lines, respectively. Flow cytometry plots showing the level of expression of PD-L1 (gray solid line) and PD-L2 (red line) relative to FMO control (unfilled line) (third row). (B) Cytotoxicity of thyroid cancer patient-derived ICAM1-CAR T cells (for donor and CAR T information, refer to Supplementary Table 1) against target ATC cell lines and control cells were examined in combination with PD1 blocking antibody. Peripheral T cells were isolated from patients with ATC, PDTC, and WDPTC. 5×10³ target cells were co-cultured either with non-transduced T (NT) cells or anti-ICAM1 CAR T cells at a 2.5:1 ratio (1.25×10⁴ cells) in media (n = 3–7 per group and representative of two to three independent experiments). (C) Differences in target cell killing were compared at a timepoint when approximately 50% of the 8505C cells were killed (24 hr for ATC, 22 hr for PDTC, and 48 hr for WDPTC). Statistical significance was determined by one-way ANOVA for CAR T vs. CAR T + αPD1 and CAR T vs. non-transduced T (NT) cells. *, P < 0.05; **, P < 0.01; ***, P < 0.001. Data represents mean ± sem (results were confirmed by the Kruskal-Wallis test).
