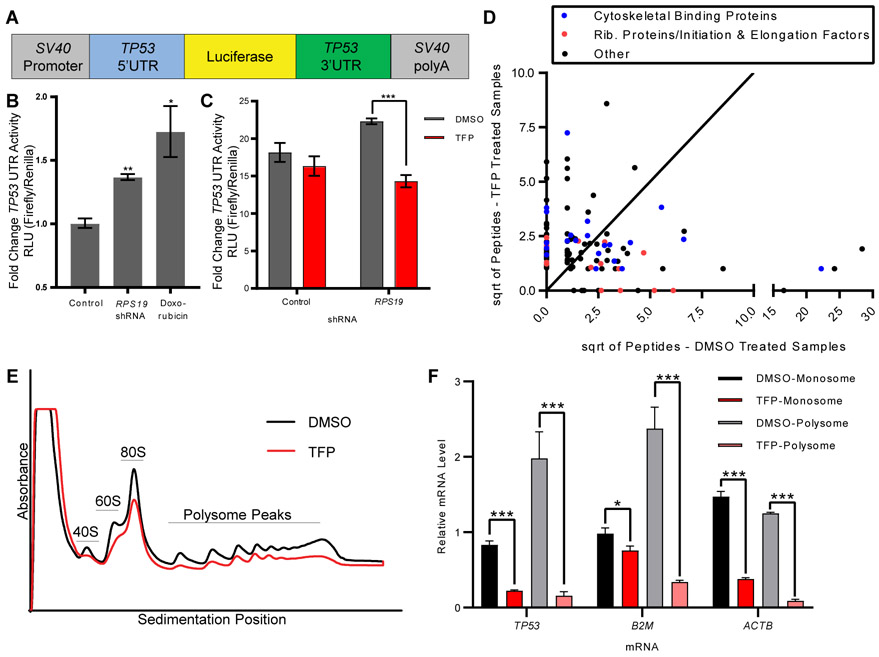
Fig. 3. TFP inhibition of translation is sufficient to decrease translation of p53.
A. Schematic of construct with TP53 UTRs and luciferase(20).
B. 293T cells were transduced with RPS19 shRNA or treated with doxorubicin before transfection with TP53 UTR luciferase construct and control Renilla luciferase construct. Y-axis shows relative luminescence units, representing the ratio of firefly luciferase (p53 UTR construct) to Renilla luciferase (control). Student t-test, *p < 0.05, **p <0.01.
C. 293T cells were transduced with RPS19 shRNA or control, treated with DMSO or TFP, and transfected with TP53 UTR luciferase construct and control Renilla luciferase construct. Y-axis shows relative luminescence units, representing the ratio of firefly luciferase (TP53 UTR construct) to Renilla luciferase (control). Student t-test, ***p < 0.001.
D. RNA Affinity Purification (RAP) identified proteins bound to TP53 mRNA in the presence or absence of TFP. Axes show the square roots of summed peptide counts from mass spectrometry. Each dot represents a protein observed bound to TP53 mRNA more than control mRNA.
E. CD34+ cells were transduced with shRNA against RPS19, sorted for successfully transduced GFP+ cells, and treated with DMSO or 10 μM TFP for 24 hours. Polysome profiles were generated, with the y-axis representing absorbance. Black line is the profile for DMSO-treated cells, red line is the profile for TFP-treated cells.
F. RNA was isolated from monosome and polysome fractions of treated cells, and TP53, β2M, and ACTβ mRNAs were measured by qPCR. Relative mRNA quantity represents Ct values normalized to each sample’s pool of all polysome fractions. Student’s t-test, *p < 0.05, *** p < 0.001.

