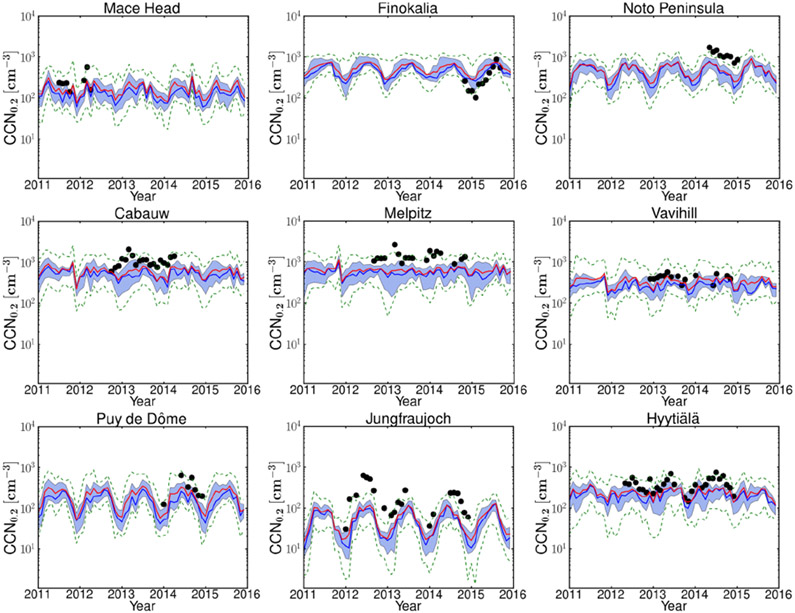
Figure 2.
Monthly ensembles for the years 2011–2015 of the CCN number concentration for supersaturation 0.2% (CCN0.2). The CCN0.2 obtained from observational data is shown with symbols. The continuous bold blue and red lines show the monthly median and mean of all models, respectively. The shaded area shows 25% and 75% of the model results, while the green dashed lines show the minimum and maximum values of all models.

