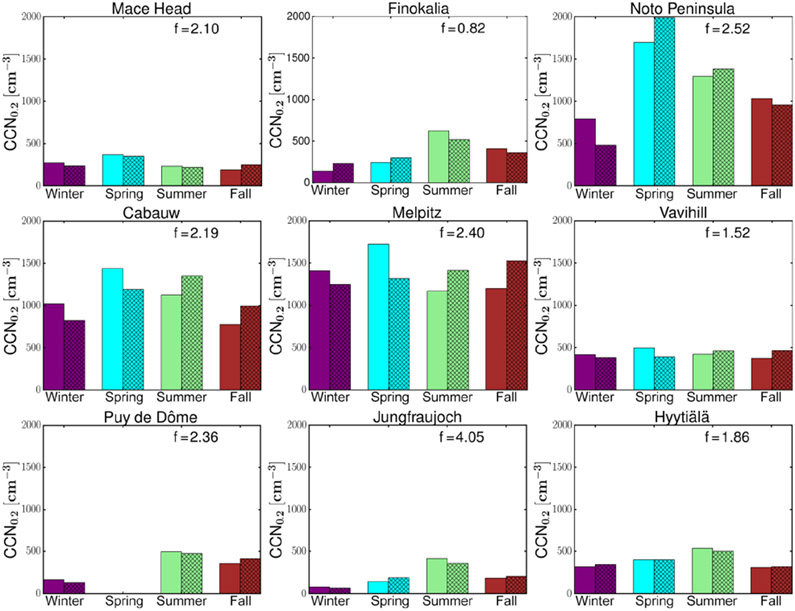
Figure 3.
Comparison of the seasonal variations of the observed and model median computed CCN0.2. The solid bars show the average of the observed CCN0.2 during each season and the shaded bars the corresponding averages of the model results. The simulated CCN0.2 concentrations have been scaled by a factor, f (denoted in each graph), so that the four-season mean is the same as the observed one. For Puy de Dôme the normalization is based on the mean of three seasons (winter, summer and fall) due to data availability.

