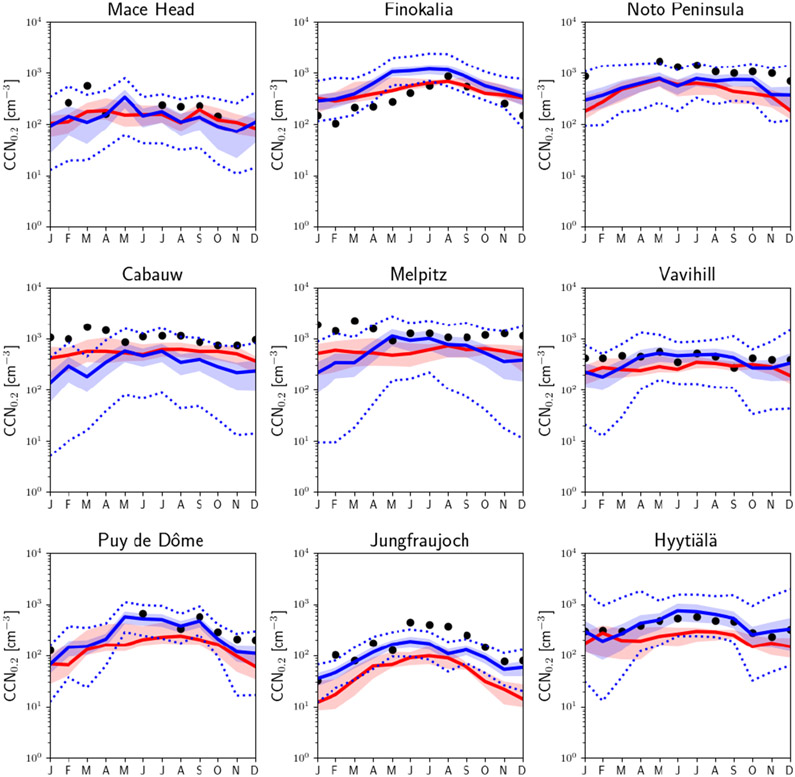
Figure 5.
Monthly average CCN0.2 based on HadGEM3-UKCA perturbed parameter ensemble simulations for the year 2008. The solid blue line shows the mean of the sample of 260 000 model variants from the emulator for each month and station. The shaded blue area shows the range of this mean plus and minus 1 standard deviation, while the blue dashed lines show the minimum and maximum sampled values. The red line shows the MMM results (mean of the years 2011–2015 shown in Fig. 2), and the shaded red area corresponds to the 25% and 75% quartiles. The CCN0.2 values obtained from observational data are shown by symbols (mean of the available data).

