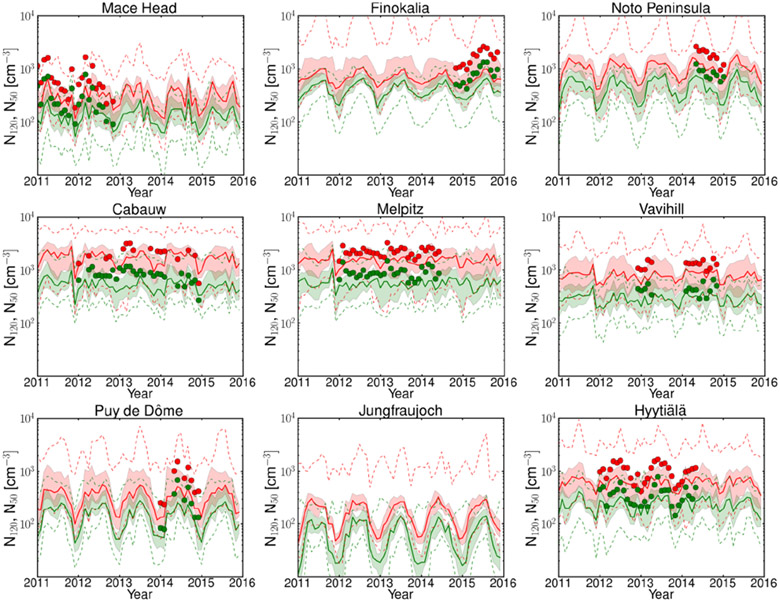
Figure 6.
Monthly ensembles for the period 2011–2015 of the number concentration of particles with diameters larger than 50 nm (N50 – in red) and 120 nm (N120 – in green). The continuous lines correspond to the median of the models for each month; the shaded areas show the 25% and 75% quartiles and the dashed lines the minimum and maximum of all models for the N50 (red area) and N120 (green area). Observational data are available for all stations except Jungfraujoch and are shown with symbols of the corresponding color.

