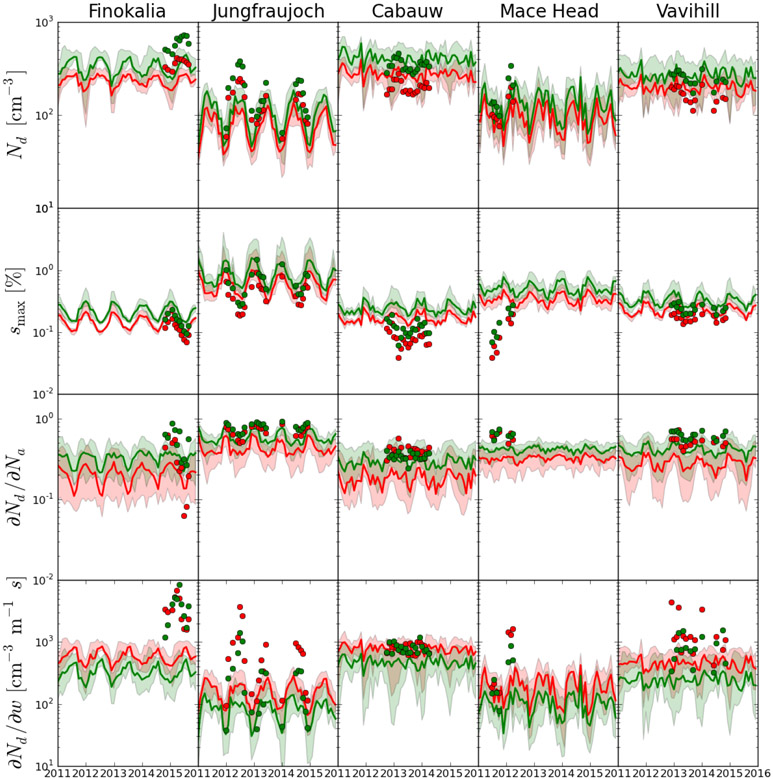
Figure 8.
Comparison between the observed (symbols) and the monthly averages of all models (continuous lines) of the cloud droplet properties: in red for updraft velocity w = 0.3 ms−1 and in green for updraft velocity w = 0.6 ms−1. For each station from top to bottom the four graphs show (as indicated in the y axis label) the number of cloud droplets, Nd, the maximum supersaturation, smax, the sensitivity of the Nd to the total number of aerosol particles, (∂Nd/∂Na), and the sensitivity of the Nd to the updraft velocity (∂Nd/∂w).

