
Figure 1. TNF‐R1 on tumor vasculature is sufficient for the antitumor effect of TNF, but not for its shock‐inducing effect.
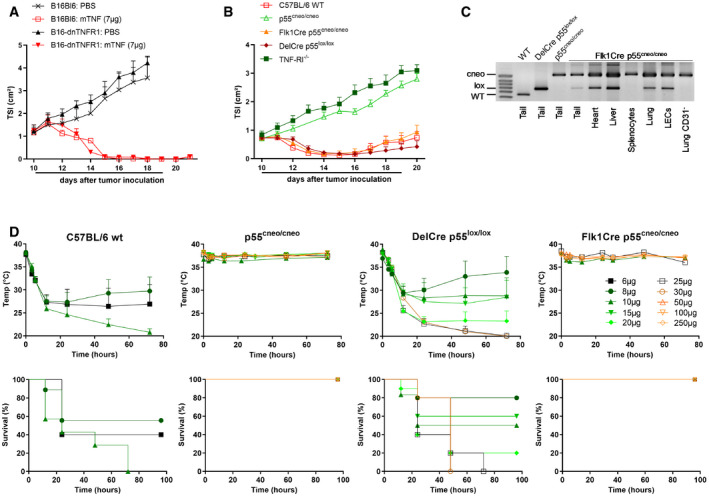
- C57BL/6 mice were inoculated with 6 × 10⁵ B16Bl6 parental or dnTNF‐R1 cells on day 0 and treated daily with 7 μg mTNF p.l. from day 10. Tumor growth is shown as mean tumor size index (TSI) + SEM (n = 6). The line under the graph represents the treatment period.
- B16Bl6 tumor growth after daily p.l. treatment with 7 μg mTNF in C57BL/6J wild‐type (WT), TNF‐R1−/−, conditional TNF‐R1 reactivation knockout (p55cneo/cneo), or p55cneo/cneo mice with Cre expression in endothelium (Flk1Cre) or all cells (DelCre). Tumor growth is shown as mean TSI + SEM (n = 7 for WT and Flk1Cre, 8 for DelCre, 9 for TNF‐R1−/−, and 10 for p55cneo/cneo). The line under the graph represents the treatment period.
- PCR analysis for the detection of wild‐type, conditional knockout (cneo) or reactivated (lox) TNF‐R1 allele in whole tissues, lung endothelial cells (LECs), and lung single‐cell suspension depleted of CD31+ cells.
- Toxicity of a single i.v. bolus injection of the indicated dose of mTNF. Mean rectal body temperature + SEM and cumulative survival rates are shown (n = 4 for Flk1Cre 10 μg; 6 for DelCre 10 μg, Flk1Cre 10 μg, and p55cneo/cneo 15 μg; 7 for WT 10 μg; 9 for WT 8 μg; 10 for DelCre 20 μg; and 5 for all other groups). For continuity of the temperature graphs, dead mice were included with a temperature of 20°C.
Source data are available online for this figure.