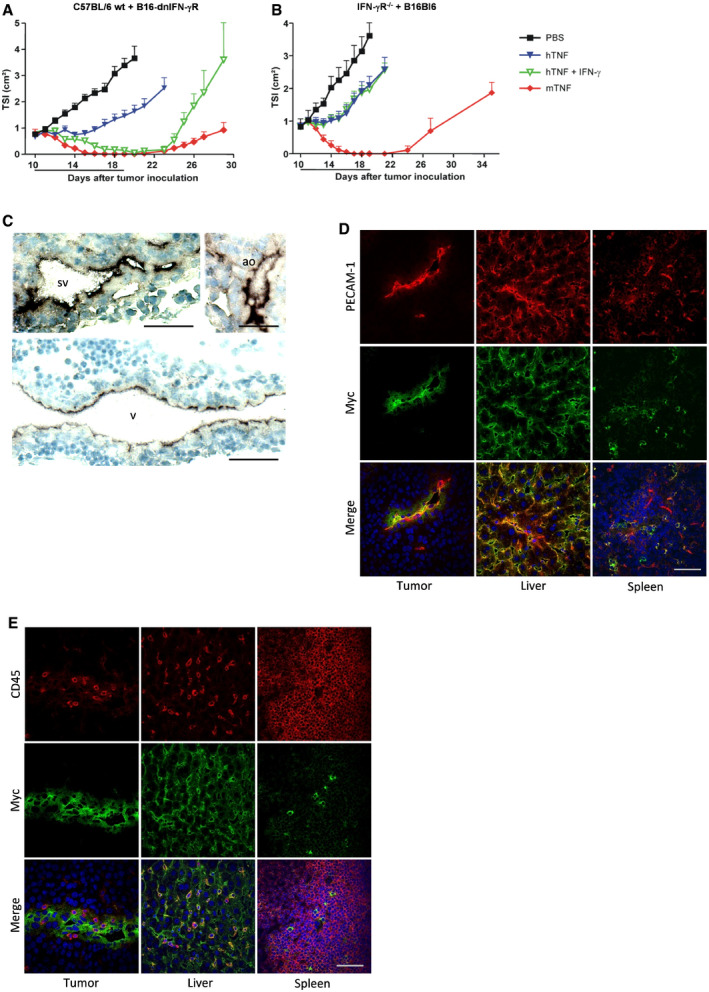
Figure EV2. The synergistic antitumor effect of TNF and IFN‐γ depends on expression of IFN‐γR on host cells, and endothelial expression of the dnIFN‐γR1 transgene in Flk1 dnIFN‐γRtg/tg mice.

-
A, BTSI of B16‐dnIFN‐γR tumor in wt C57BL/6 mice (A) or B16Bl6 parental tumor in IFN‐γR−/− mice (B). In wt mice, the growth rate of a B16‐dnIFN‐γR tumor was similar to B16Bl6 parental tumor. Mice were treated daily via p.l. injection of 7 μg mTNF, 30 μg hTNF, οr a combination of 30 μg hTNF and 10 000 IU mIFN‐γ. Data are shown as mean TSI + SEM (n = 7). The line under the graph represents the treatment period.
-
CCryosections of Flk1 dnIFN‐γRtg/tg embryos on day E10.5 were stained with anti‐c‐Myc Ab, followed by chromogenic detection with alkaline phosphatase‐conjugated anti‐mIgG Ab and BCIP/NBT substrate. Nuclei were stained with hematoxylin. Expression was visible in endothelial cells of large veins (v), sinus venosus (sv), and aorta (ao). Scale bars are 50 μm.
-
D, ECryosections of B16Bl6 tumor, liver, and spleen of adult Flk1 dnIFN‐γRtg/tg mice were stained for c‐Myc and PECAM‐1 (D) or CD45 (E). Nuclei were stained with Hoechst. Endothelial cells in tumor and liver showed positive staining for the transgene, while immune cells were mostly negative. Scale bars are 50 μm.
Source data are available online for this figure.
