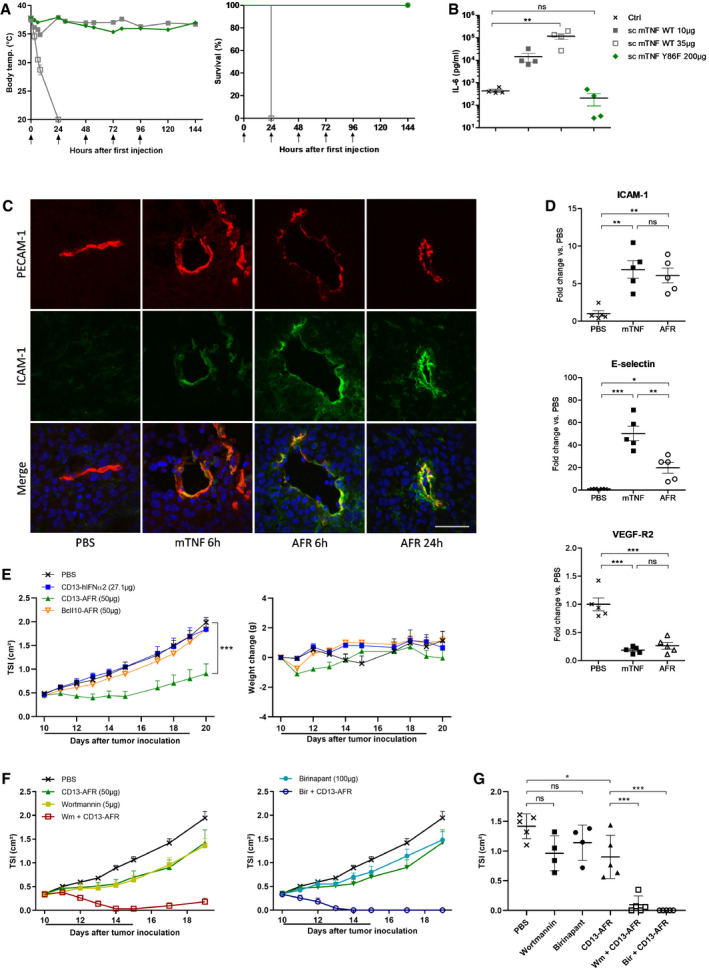
Figure 3. Sc mTNF Y86F is non‐toxic and mCD13‐AFR is active in mice.

- Toxicity of wt sc mTNF and mutant Y86F after injection (↑) in naïve C56BL/6 mice. First injection was i.v., and other injections were i.p. Mean rectal body temperature ± SEM and cumulative survival rates are shown (n = 4). For continuity of the temperature graphs, dead mice were included with a temperature of 20°C.
- Plasma IL‐6 concentrations measured via ELISA. Blood samples were taken 6 h after i.v. injection of wt sc mTNF or mutant Y86F. Values of individual mice and mean + SEM are shown. **P < 0.01; ns, non‐significant by one‐way ANOVA with Bonferroni's multiple comparison test.
- Immunohistochemical staining for PECAM‐1 (red), ICAM‐1 (green), and DNA (blue) of B16Bl6 tumors after p.l. treatment with 7 μg wt mTNF or 50 μg of mCD13‐AFR. Scale bar is 50 μm.
- Expression of ICAM‐1, E‐selectin, and VEGF‐R2 in B16Bl6 tumor 6 h after treatment, by qPCR analysis of whole tumor RNA. Error bars are SEM. ns, non‐significant; *P < 0.05; **P < 0.01; ***P < 0.001 by one‐way ANOVA with Bonferroni's multiple comparison test.
- Tumor growth and body weight change after daily p.l. injection of the indicated (equimolar) doses of mCD13‐AFR, non‐targeted AFR (BcII10‐AFR) or mCD13 VHH control (CD13‐hIFNα2) in the B16Bl6 melanoma model. The line under the graph represents the treatment period. Tumor growth is shown as mean TSI, and error bars are SEM (n = 5). ***P < 0.001 by two‐way ANOVA with Bonferroni's multiple comparison test.
- B16Bl6 tumor growth after daily p.l. treatment with the indicated doses of mCD13‐AFR, Wortmannin (Wm), Birinapant (Bir), or combinations thereof. Wortmannin and Birinapant were given 1 h before CD13‐AFR. Tumor growth is shown as mean TSI + SEM (n = 4 for Wm and Bir, 5 for other groups). The line under the graph represents the treatment period.
- TSI of individual tumors of the indicated treatment groups at day 17 after tumor inoculation. Error bars are SEM. ns, non‐significant; *P < 0.05; *** < 0.001 by one‐way ANOVA with Bonferroni's multiple comparison test.
Source data are available online for this figure.
