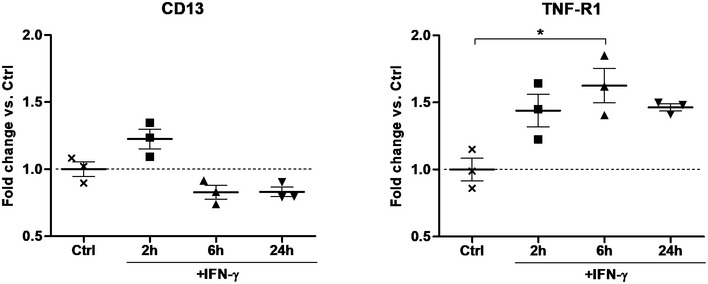
Figure EV3. IFN‐γ increases TNF‐R1 expression in HUVECs.

qPCR analysis for TNF‐R1 and CD13 expression on RNA isolated from HUVECs after stimulation with 100 ng/ml hIFN‐γ. Individual values are shown. The horizontal lines indicate the mean per condition. Error bars are SEM. *P < 0.05 by one‐way ANOVA with Bonferroni's multiple comparison test.Source data are available online for this figure.
