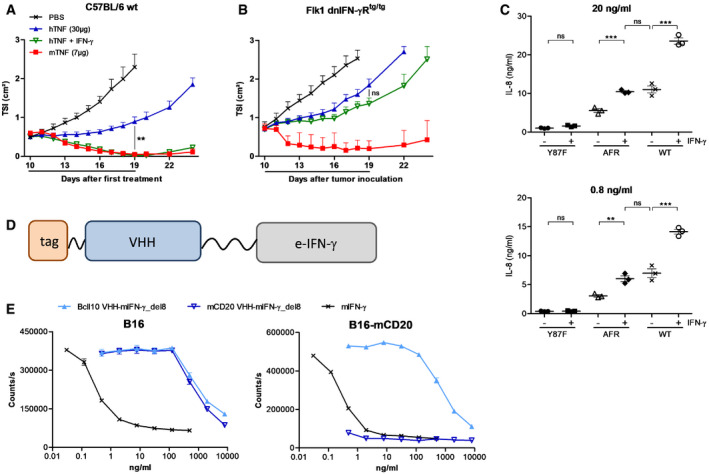
Figure 5. IFN‐γ sensitizes tumor endothelial cells for TNF .

-
A, BB16Bl6 tumor growth after daily p.l. treatment with 7 μg mTNF, 30 μg hTNF alone, or in combination with 10 000 IU mIFN‐γ in wt C57BL/6 mice (A) or homozygous Flk1 dnIFN‐γR1 transgenic mice (B). The line under the graph represents the treatment period. Tumor growth is depicted as mean TSI, and error bars are SEM (n = 5). ns, non‐significant; **P < 0.01 by one‐way ANOVA with Bonferroni's multiple comparison test.
-
CIL‐8 concentration in HUVEC supernatant after 24‐h stimulation with the indicated concentration of sc hTNF mutant Y87F (Y87F), hCD13‐AFR or wt hTNF, alone or in combination with 200 ng/ml hIFN‐γ, measured via ELISA. Error bars are SEM. ns, non‐significant; **P < 0.01; ***P < 0.001 by one‐way ANOVA with Bonferroni's multiple comparison test. Individual values are shown. The horizontal lines indicate the mean per condition.
-
DSchematic representation of AFN‐II, consisting of a VHH fused via a 20xGGS linker to an engineered IFN‐γ (e‐IFN‐γ) variant and N‐terminal affinity tag.
-
EViability of B16Bl6 parental or mCD20‐expressing cells after 72‐h stimulation with wt mIFN‐γ or del8 mutant fused to a BcII10 or mCD20 VHH, in the presence of 60 ng/ml mTNF. Cell viability was measured via an ATP luminescence assay. Each point is the mean of three replicates, and error bars are SEM.
Source data are available online for this figure.
