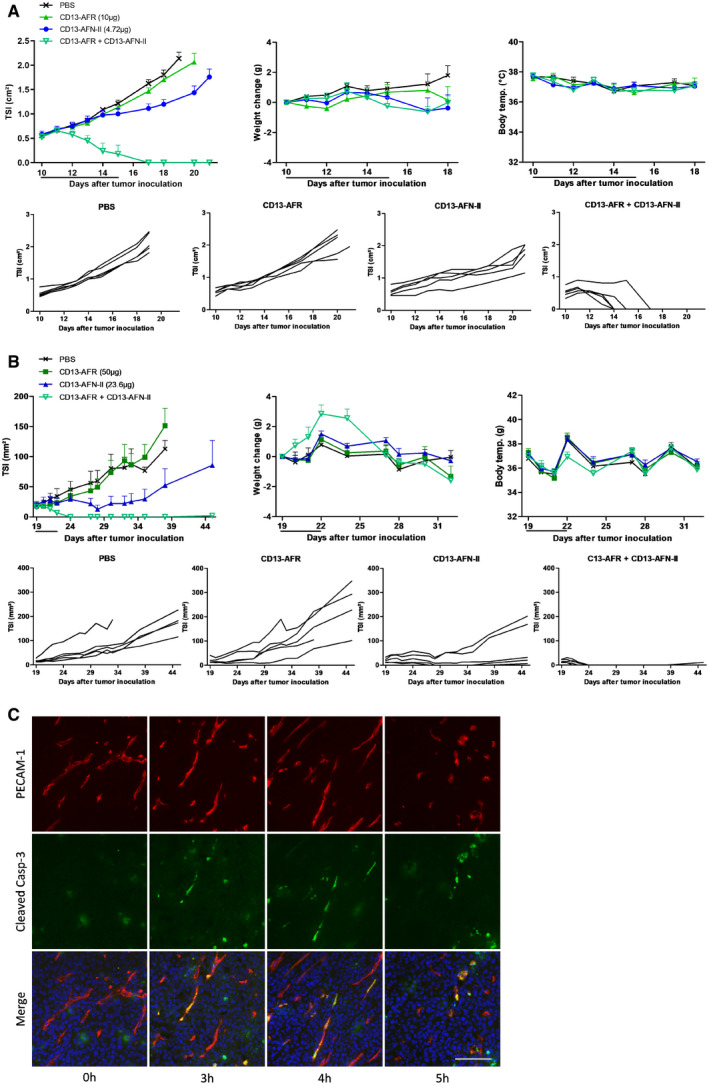
Figure 6. CD13‐AFN‐II synergizes with CD13‐AFR for tumor destruction.

-
A, BTumor growth, body weight change, and rectal body temperature after daily p.l. treatment with mCD13‐AFR, mCD13‐AFN‐II, or combination thereof, in the B16Bl6 model in C57BL/6 mice (A) or RL model in NSG mice (B). Tumor growth is shown as mean TSI, and error bars are SEM (n = 5) (upper panel), or as TSI of individual mice (lower panel). The line under the graph represents the treatment period.
-
CImmunohistochemical staining for PECAM‐1 (red), cleaved caspase‐3 (green), and DNA (blue) of B16Bl6 tumors after p.l. treatment with 50 μg mCD13‐AFR and 23.8 μg mCD13‐AFN‐II. Scale bar is 100 μm.
Source data are available online for this figure.
