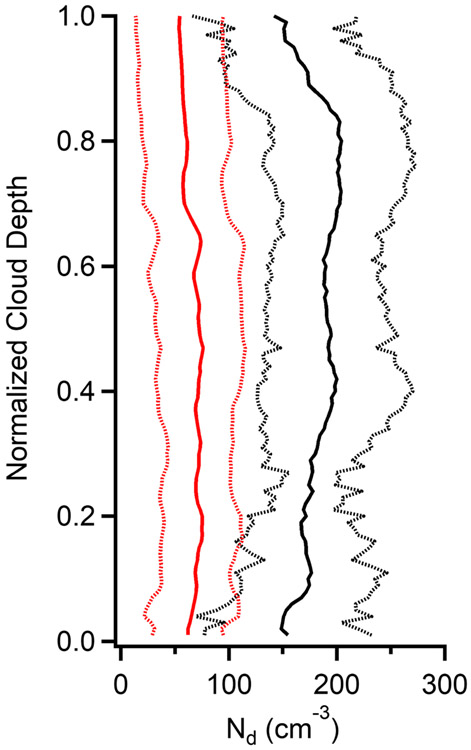
Figure 5.
The vertical profiles of Nd plotted as a function of cloud normalized depth for the selected soundings shown in Table 1. The solid black and red lines represent average values for conditions of BB influence and minimal impact from any sources of aerosol pollution, respectively. Dashed lines indicate one standard deviation.

