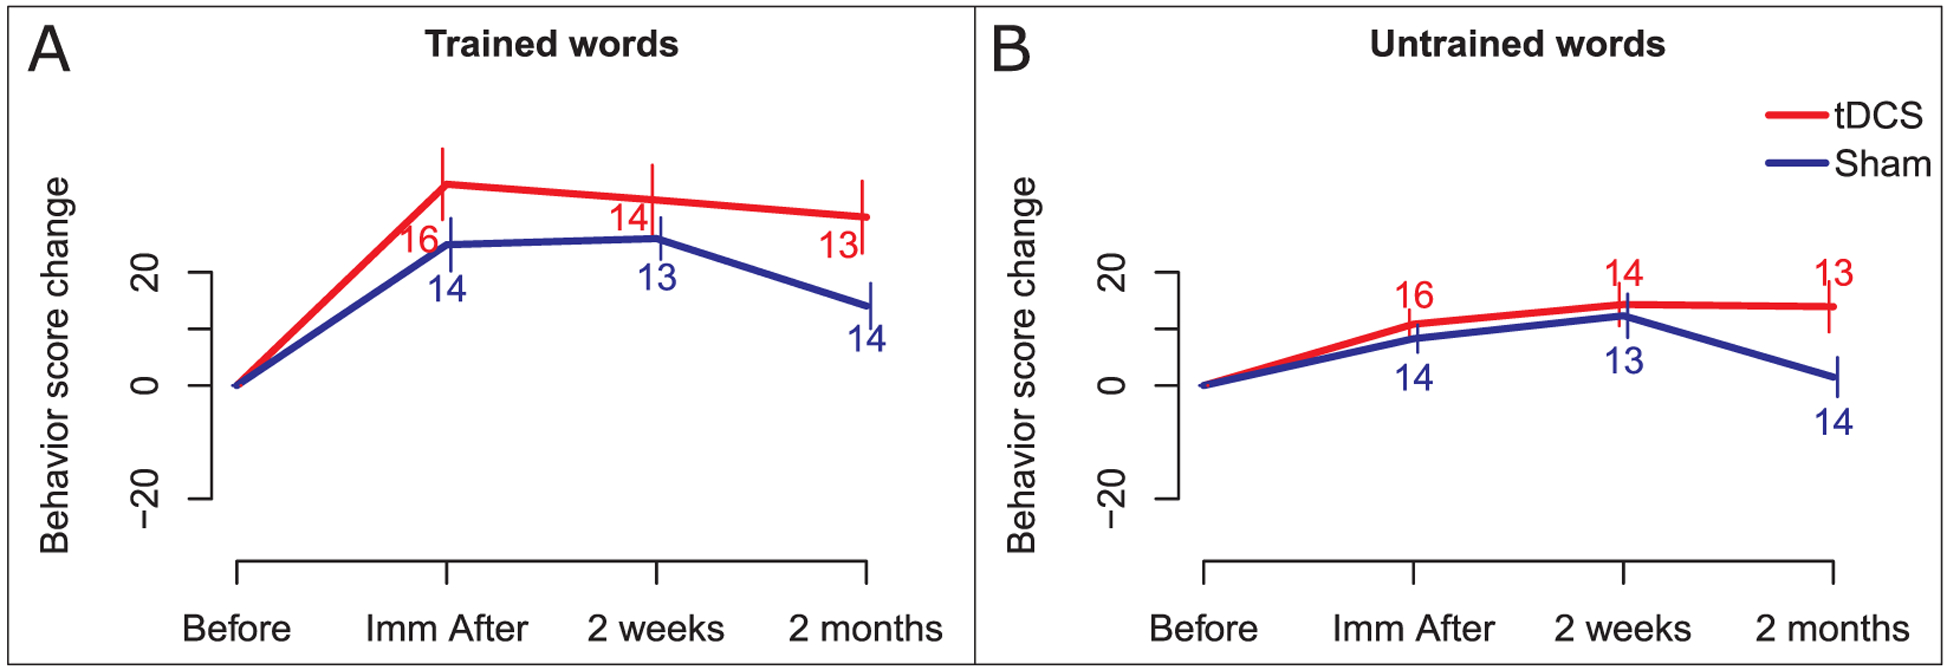
Fig. 3.

Effects of tDCS on behavioral score change. Change from baseline on behavioral scores is presented in the y axis, and each post-therapy time-point is presented on the x-axis. Scores are presented in red for the tDCS group and in blue for the Sham group. Panel A: tDCS effect for trained words. Panel B: tDCS effects for untrained words.
