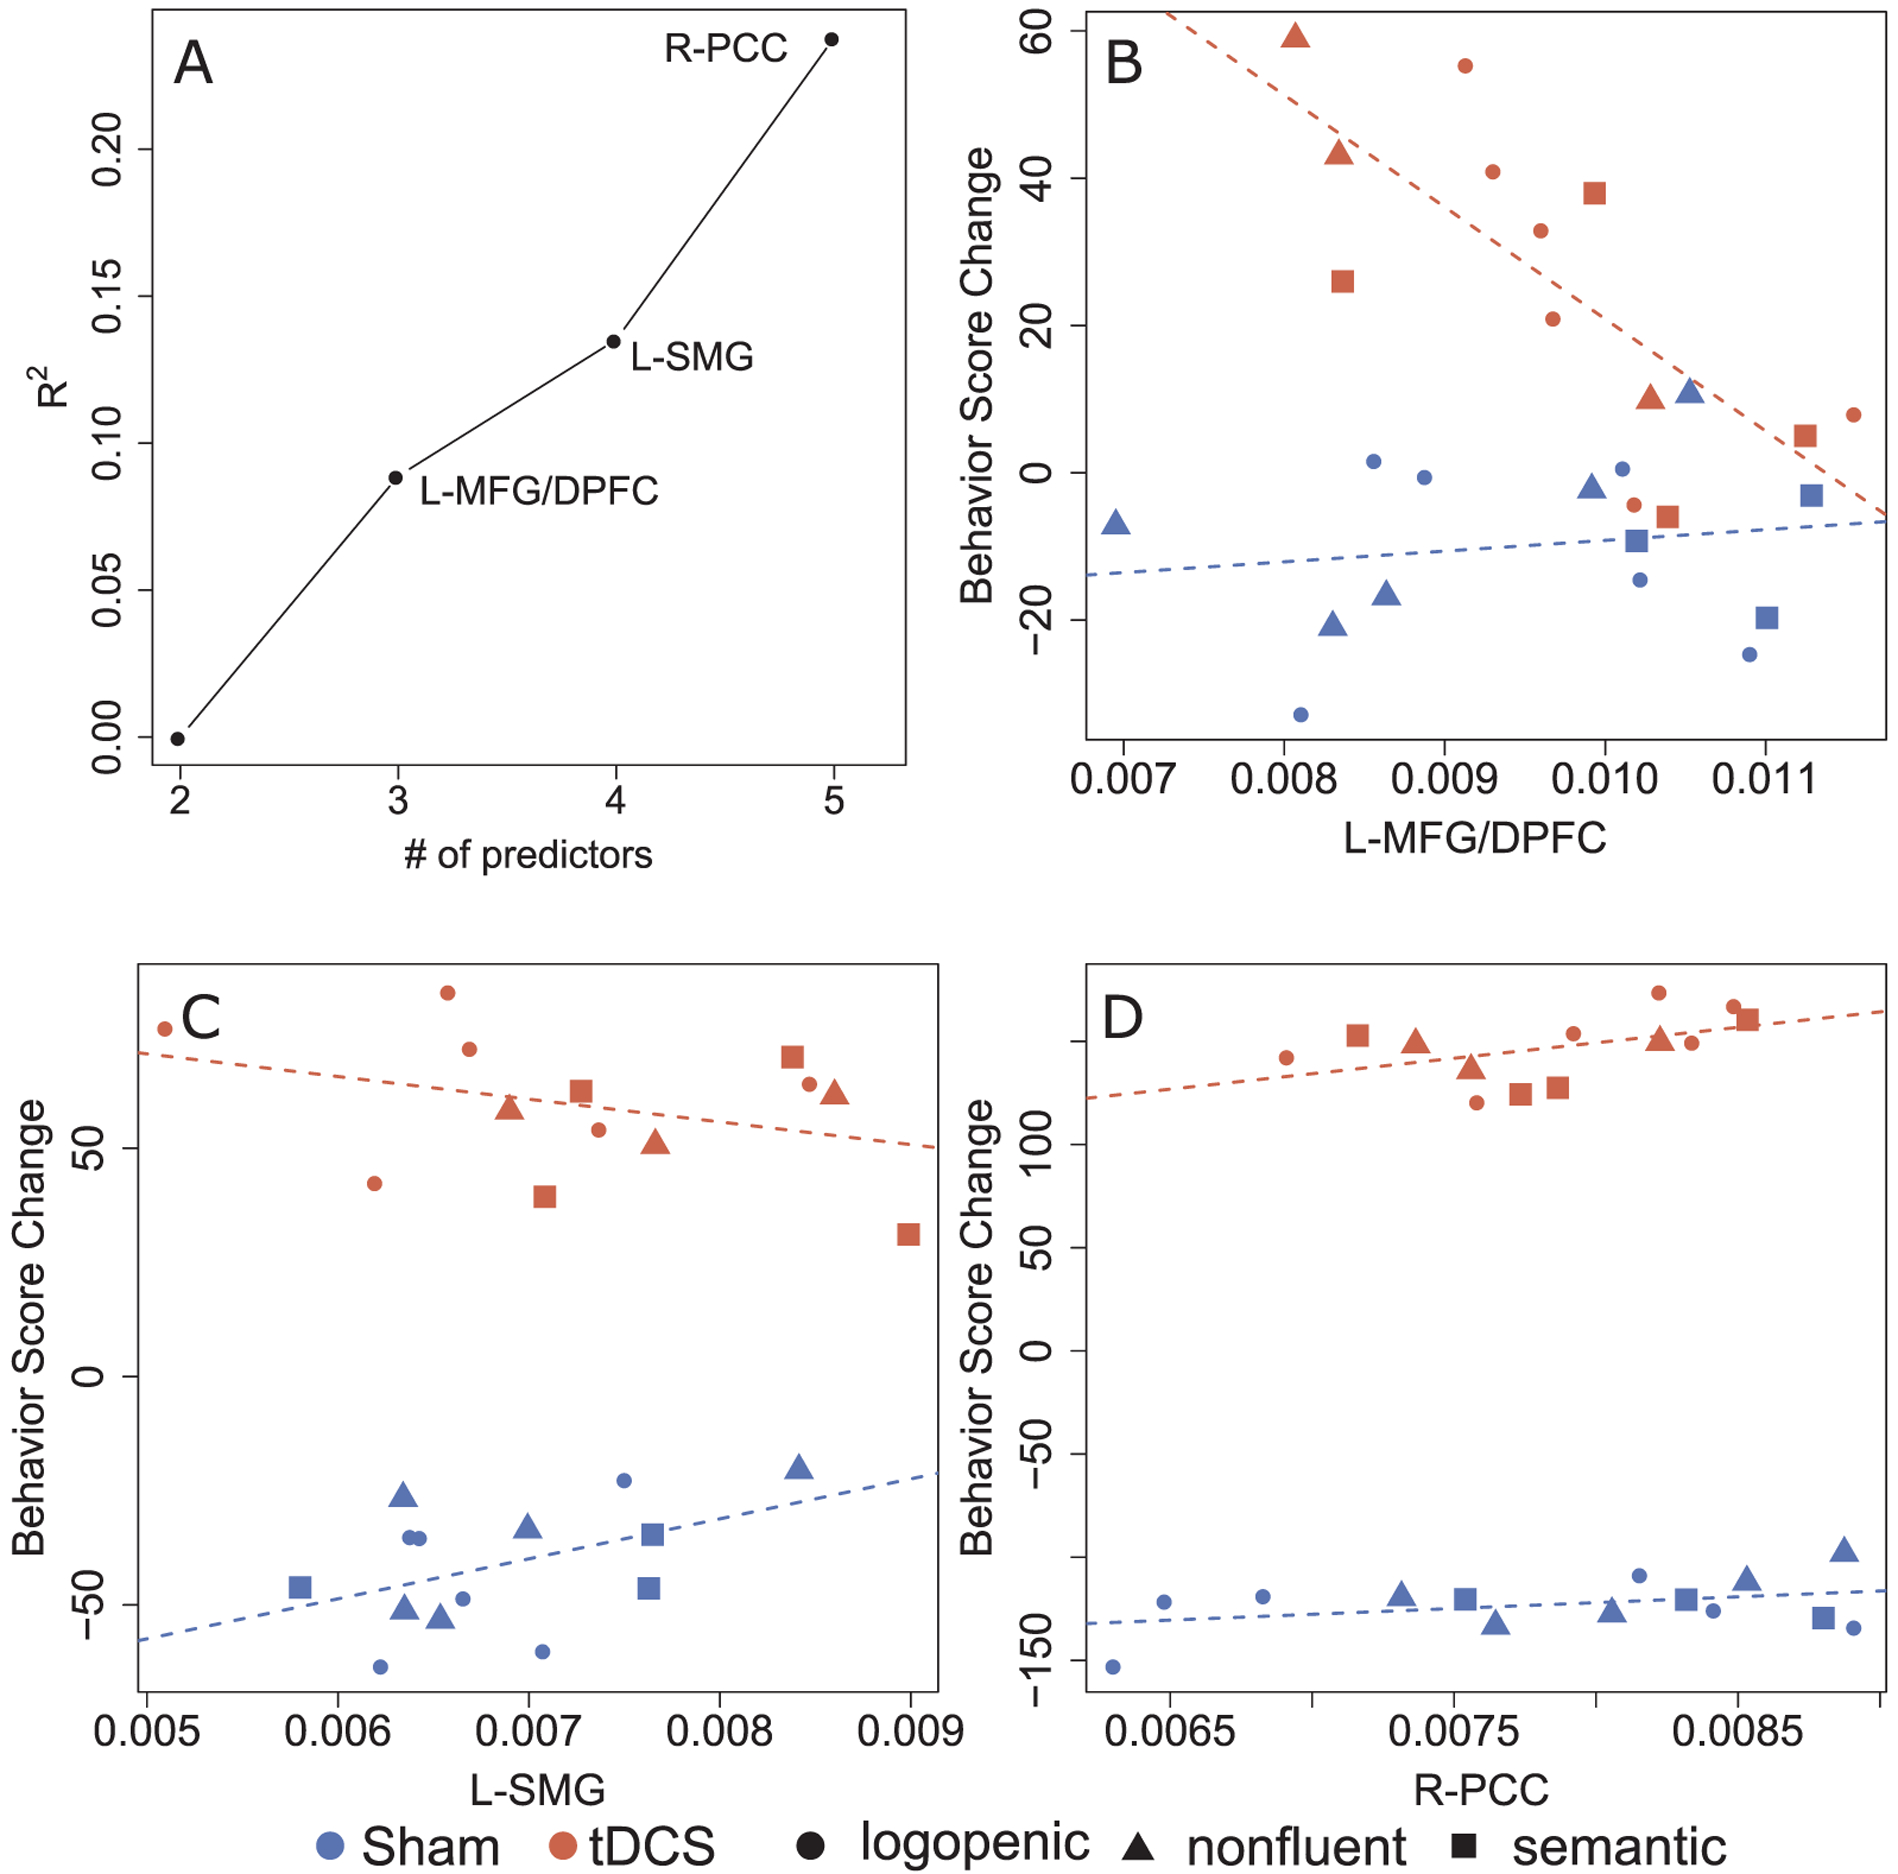
Fig. 5.

Predictors of percent change in spelling accuracy: untrained words (2 months after therapy). Brain regions showing significant interactions between stimulation and volumetric data in predicting change in letter accuracy are presented. Panel A represents R2 increase obtained when adding each ROI to the model containing adjustments for pre-therapy scores and Global Atrophy. Panels B to D contain scatter plots of behavioral score (that is, % letter accuracy) change in relation to the pre-therapy assessment (on the y axis) versus brain volume. In each scatter plot, the y axis is the behavioral score change adjusted using regression coefficients, that is, accounting for the remaining variables included in the model. Red represents points for patients in the tDCS group, and blue for the Sham group. Participants with different PPA variants are represented with different symbols: ● lvPPA; ▲ nfvPPA; ■ svPPA.
