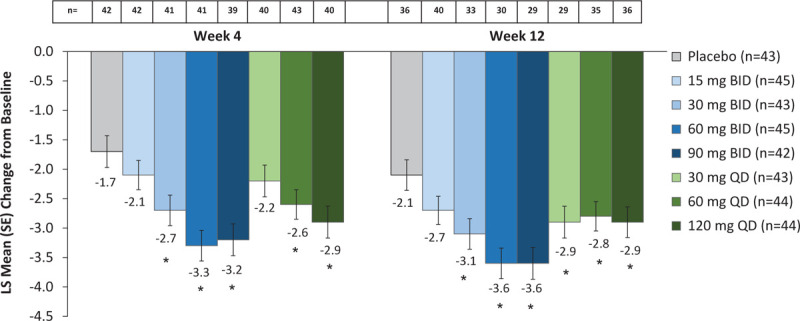
FIG. 4.

Change from baseline in GCS vasomotor symptom score. LS means and SEs are from a mixed model for repeated measurements with change from baseline as the dependent variable and the treatment group, visit and smoking status as factors and baseline measurement as a covariate as well as interaction of treatment by week and an interaction of baseline measurement by week. Baseline values on the VMS function domain ranged from 0 to 6 with a mean score of 4.8 (SD 1.4). Reductions from baseline indicate improvement. ∗P < 0.05 for paired comparisons of fezolinetant versus placebo at last on-treatment week, with no adjustments for multiplicity. GCS, Greene climacteric scale; LS, least squares; SE, standard error, VMS, vasomotor symptom.
