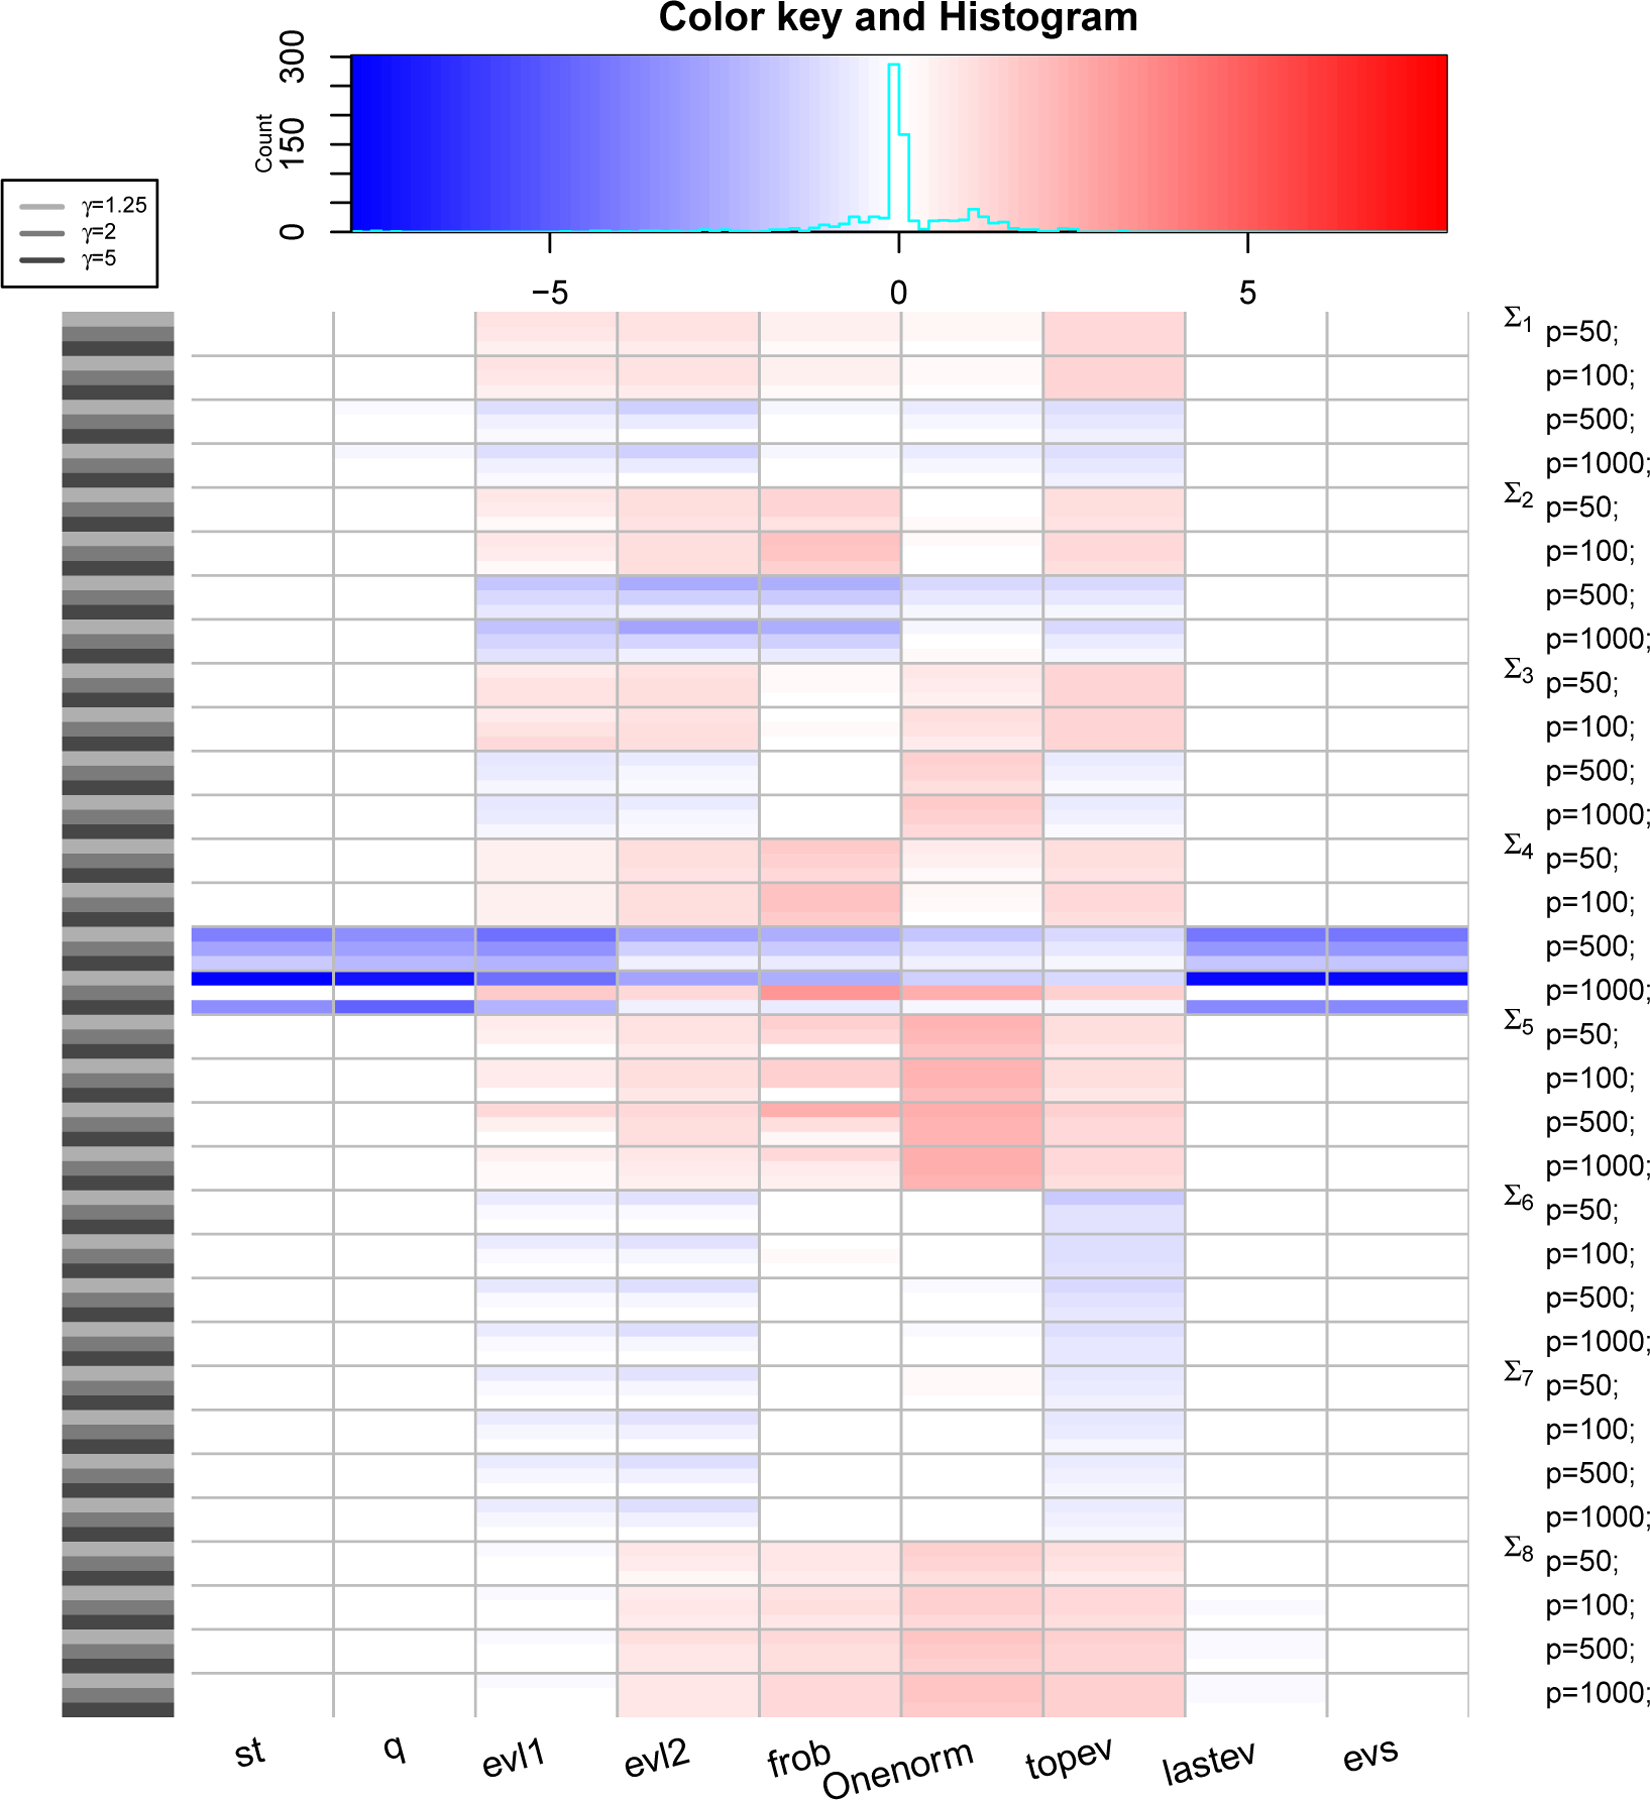
Figure 4: PRIAL comparison with LW2.

The heatmap shows values of PRIAL of with respect to for various simulation scenarios based on covariance structure, values of p and γ (rows) and various loss functions (columns). Top panel shows counts and histogram of various PRIAL values. PRIAL values are scaled column-wise for visual clarity. Red (blue) shades mean PRIAL > 0 (PRIAL < 0) indicating our estimator is better (worse) than LW2.
