FIGURE 2.

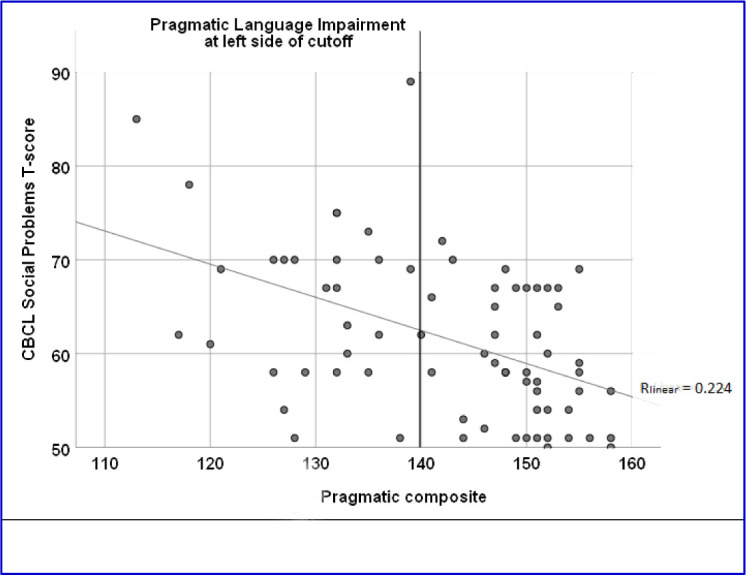
Scatterplot between parental Pragmatic Composite scores and CBCL Social problems T-scores. Cutoff-line for PLI and regression line for the correlation

Scatterplot between parental Pragmatic Composite scores and CBCL Social problems T-scores. Cutoff-line for PLI and regression line for the correlation