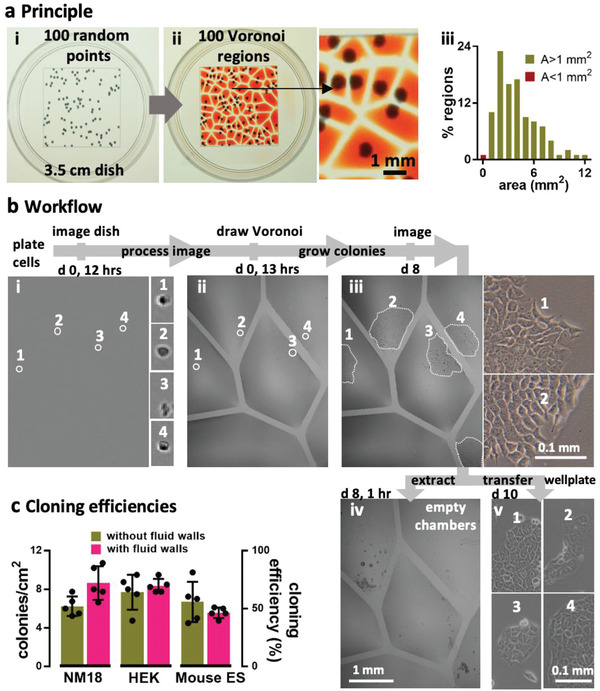
Figure 3.

Beating the Poisson limit during cell cloning. a) Principle illustrated using 100 randomly distributed dots in a 2 cm square printed on clear film placed under a 35 mm dish. i) Dish + dots. ii) After recording dot positions, the Voronoi diagram is determined, polygonal walls built around each dot, and each polygonal chamber filled with dye (zoom shows some chambers). iii) Distribution of areas in this Voronoi diagram. Two polygons had area (A) <1 mm2, a threshold determined by the minimum area (hence volume) the infusing needle can access. b) Workflow illustrated using NM18 cells (12 cells cm−2 or ≈48 in 2 × 2 cm square) plated in a 35 mm dish. Phase‐contrast images are of the same region, and numbered zooms show magnifications of different founder cells and their colonies. i) Cells 1–4 12 h after plating. ii) The same cells after jetting surrounding polygons. iii) By day 8, cells develop into colonies (outlined by dotted lines). iv) Emptied polygons (achieved by adding/removing PBS, adding trypsin, incubation, and removing most cells). Overemptying some chambers leaves FC40 (dark blobs) attached to the bottom. v) After removal, each clone was reseeded in a well in a 12‐well plate, and imaged 2 days later. c) Cloning efficiencies. Each cell type was seeded (12 cells cm−2) in 10 × 35 mm dishes, colonies counted after 8 days, and cloning efficiencies calculated. Five dishes were used to assess cloning efficiencies conventionally (“without fluid walls”), and five using polygons (“with fluid walls”). There was no or little significant difference between the two approaches (unpaired t test for HEK, ES, and NM18 gave p = 0.488, 0.3, and 0.033, respectively).
