
Figure 3.
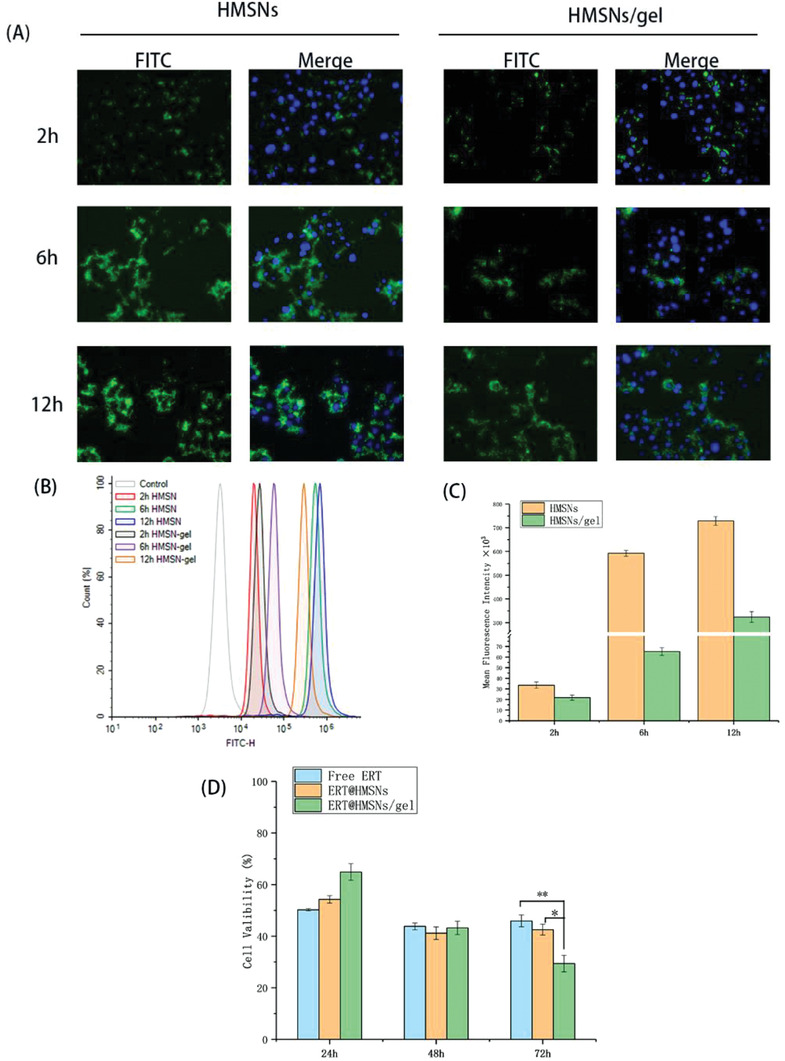
Cellular uptake of different ERT formulations in A549 cells. The FITC‐labeled formulations were added into transwell inserts and then incubated with cells at different time. A) HMSNs accumulation was represented by the fluorescence of FITC which was observed by fluorescence microscopy. B,C) Quantitative analysis of fluorescent intensity of FITC was determined by flow cytometry; D) Viability of A549 cells incubated with ERT@HMSNs and ERT@HMSNs/gel in Transwell co‐culture systems for 24, 48, and 72 h. All quantitative data are given as mean ± SD (n = 3). “*” and “**” mean p < 0.05 and 0.01, respectively. Scale bar: 20 µm