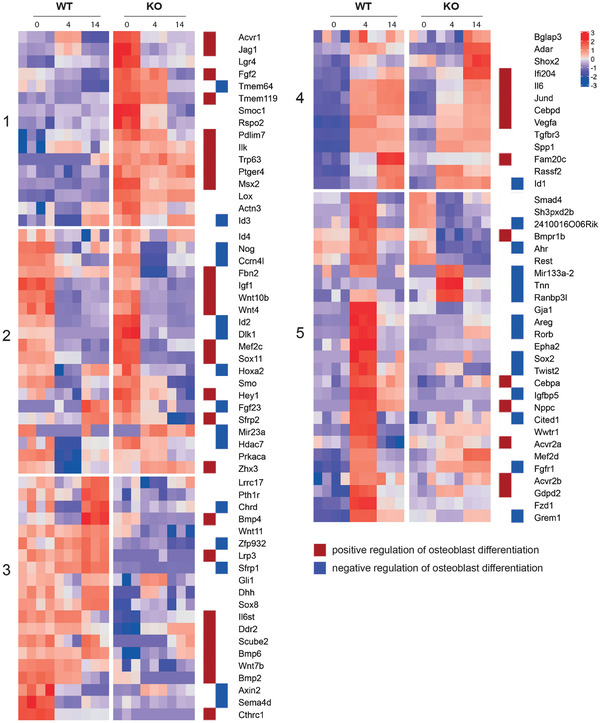
Figure 3.

Loss of β‐actin leads to dysregulation of temporal expression of OBD genes. Gene expression data for 96 OBD genes that are significantly DE (p‐adjusted < 0.05, |fold change| > 2) in at least one between‐groups pairwise comparison (WTM vs KOM, WT4 vs KO4, WT14 vs KO14). Heatmap is based on z‐score‐normalized data and shows temporal gene expression patterns. Hierarchical clustering was performed using Ward's linkage using k = 5 clusters. Red and blue squares identify whether the gene is involved in positive regulation of OBD (red) or negative regulation of OBD (blue).
