Figure 4.

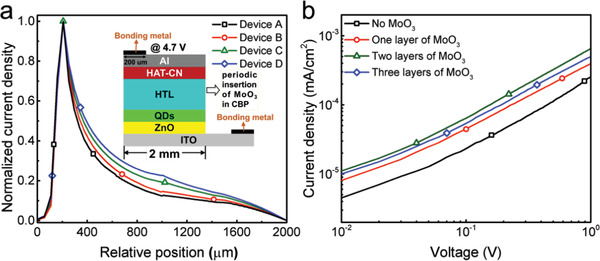
a) Calculated lateral current distribution in the CBP layer that is closest to QD emissive region for devices A–D at the voltage of 4.7 V, respectively. b) J–V curves for hole‐only devices.

a) Calculated lateral current distribution in the CBP layer that is closest to QD emissive region for devices A–D at the voltage of 4.7 V, respectively. b) J–V curves for hole‐only devices.