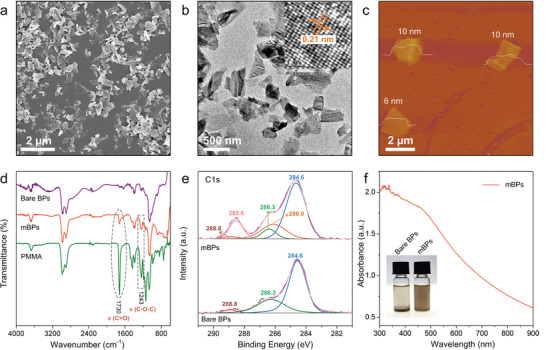
Figure 1.

a,b) SEM and TEM images (HR‐TEM image shown in the inset) of the mBPs; c) AFM image of the mBPs; d) FTIR spectra of the bare BPs, mBPs, and PMMA; e) XPS C 1s spectra of the bare BPs and mBPs; f) Absorption spectrum of the mBPs with the inset showing the photographs of the bare BPs and mBPs in CH2Cl2.
