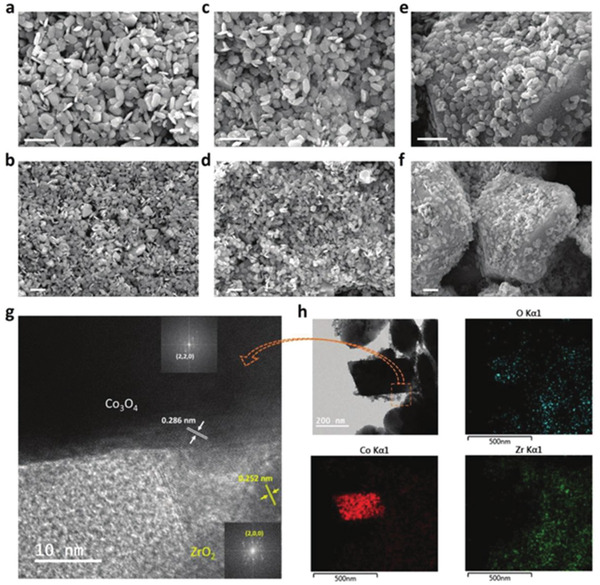
Figure 7.

SEM micrographs of the a,b) 1–2 ZrO2/Co3O4, c,d) 1–4 ZrO2/Co3O4, and e,f) 1–6 ZrO2/Co3O4 electrocatalysts. The scale bars in (a–f) are 1 µm. g) High‐resolution (HR)‐TEM image. The insets in (g) are fast Fourier transform patterns. h) TEM micrograph and elemental mappings of O, Co, and Zr in the 1–4 ZrO2/Co3O4 electrocatalyst. Reproduced with permission.[ 111 ] Copyright 2017, Wiley‐VCH GmbH.
