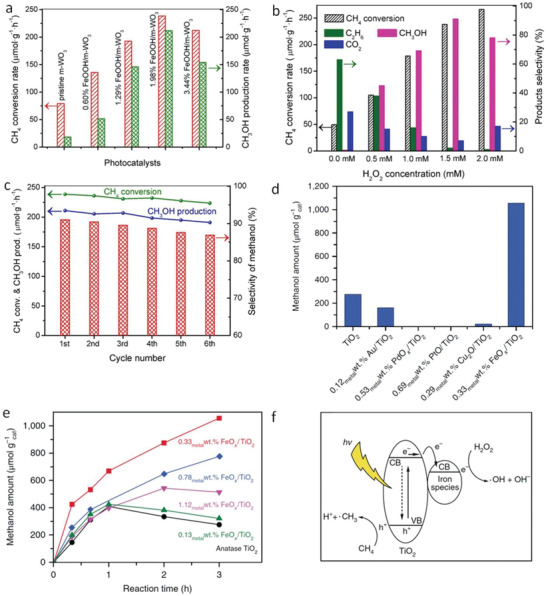
Figure 15.

a) CH4 conversion rate and methanol production rate over different catalysts, b) methane conversion rate, and product selectivity over 1.98% FeOOH/m‐WO3 as the concentration of H2O2 varied. c) Methane conversion, methanol production, and selectivity over 1.98% FeOOH/m‐WO3 in different cycles. Reproduced with permission.[ 155 ] Copyright 2020, Elsevier. d) Methanol production over different catalysts and e) over different amount of FeOx‐loaded TiO2. f) Photocatalytic mechanism. Reproduced with permission.[ 158 ] Copyright 2018, the authors, published by Springer Nature Limited.
