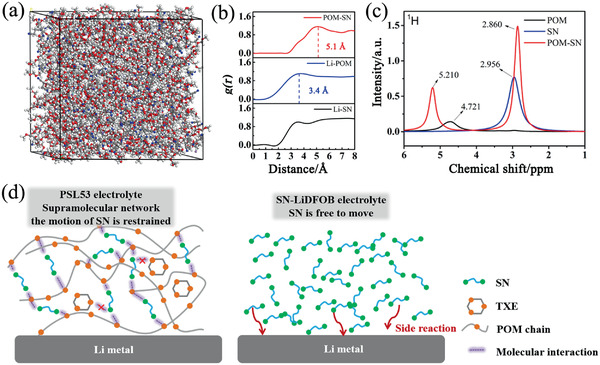
Figure 2.

a) MD simulation snapshots of LiDFOB, POM, and SN mixture. b) Radial distribution functions g(r) of Li‐SN, Li‐POM, and POM‐SN pairs calculated from MD simulation trajectories at 353 K. c) 1H MAS NMR of POM, SN, and POM‐SN mixrture. d) Comparsion of PSL53 and SN‐LiDFOB electrolyte.
