
Fig. 7.
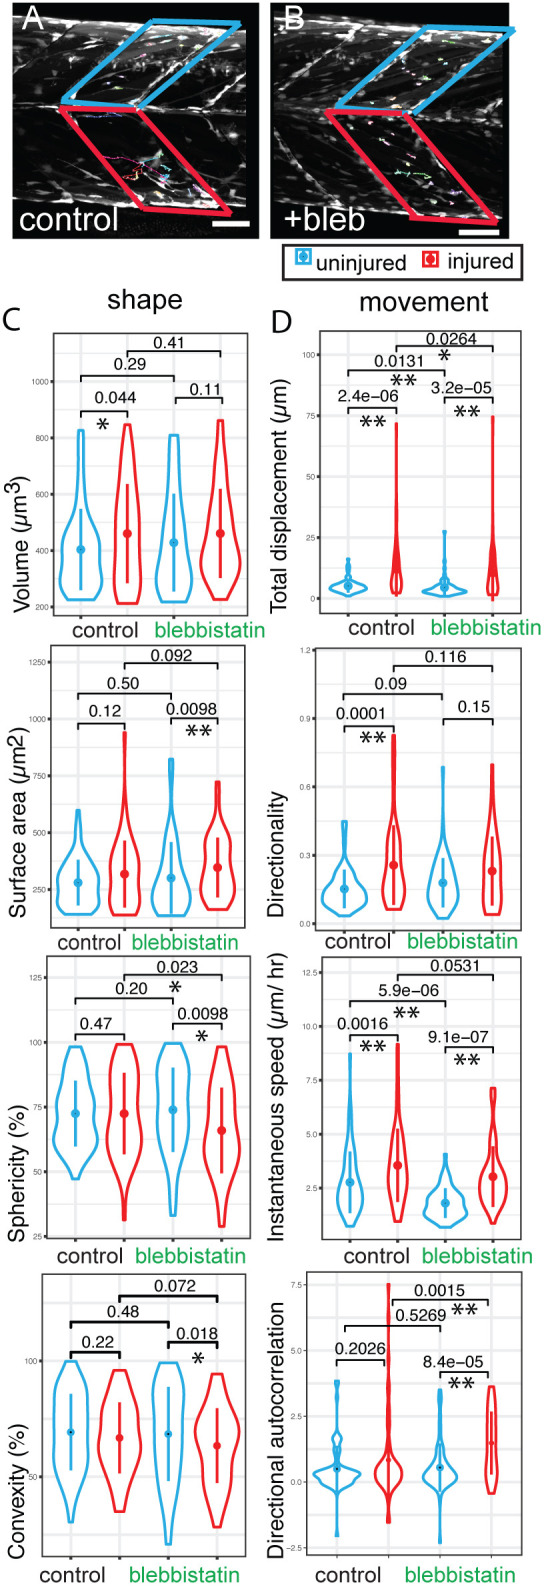
Outputs from CTP from analyses of datasets generated from 7 dpf pax7a:egfp larvae exposed to the myosin II inhibitor blebbistatin. Tracking of GFP+ cells in injured (red box) and uninjured (blue box) myotomes of pax7a:egfp larvae in the absence (A, dataset 7, n=34; dataset 8, n=47; dataset 9, n=48) or presence of 10 µM blebbistatin (B, dataset 10, n=38; dataset 11, n=31; dataset 12, n=36) was performed (n=3 animals for each condition with injured and uninjured myotomes in each animal). Violin plots (with median and interquartile range indicated) of shape (C) and movement (D) were generated from CTP outputs for cells in injured myotomes (red) and adjacent uninjured myotomes (blue) in larvae exposed to blebbistatin or water. Significance of differences in parameters of shape and movement were evaluated using Kruskal–Wallis tests and pairwise comparisons tested by Dunn post-hoc tests. Significant differences between conditions are shown with P<0.05 (*) and P<0.01(**) indicated. Scale bars: 50 µm.