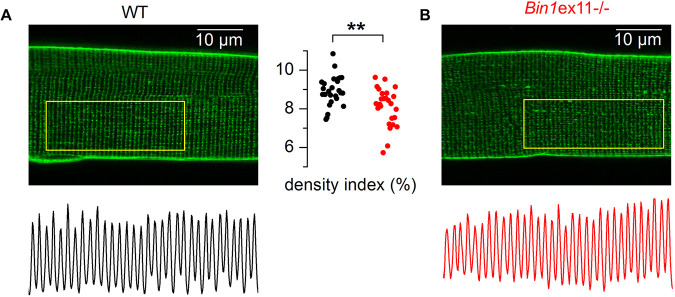
Fig. 7.
T-tubule network in muscle fibers from WT and Bin1ex11−/− mice. (A,B) x,y fluorescence images of di-8-anepps staining in fibers from a wild-type (WT) mouse (A) and from a Bin1ex11−/− mouse (B). The longitudinal profile of fluorescence along the outlined region of interest is shown below each image. The graph in the middle shows values for the T-tubule density index in fibers from wild-type mice (black points) and Bin1ex11−/− mice (red points). Unpaired Student's t-test. **P<0.01.

