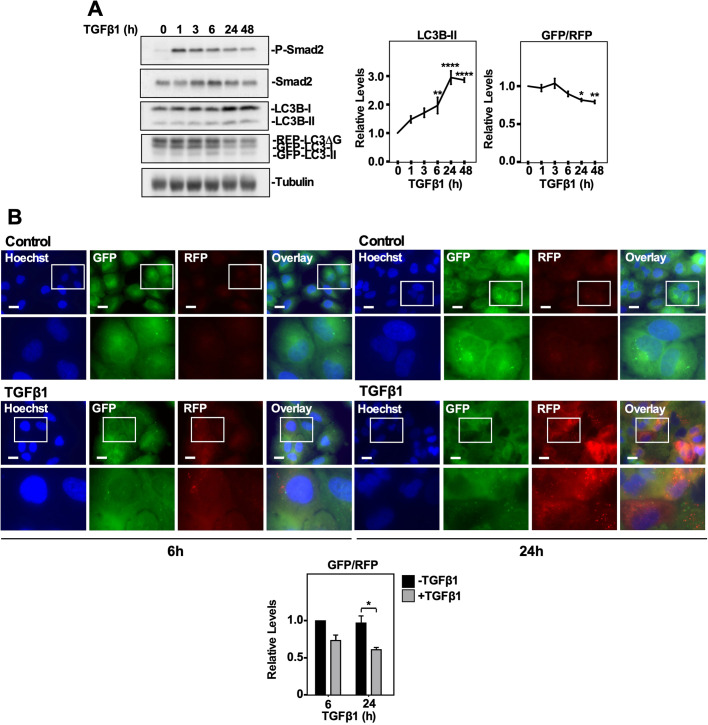
Fig. 4.
Using a GFP-LC3-RFP-LC3ΔG probe to assess TGFβ1-dependent autophagy in A549 cells. (A) A549 cells stably expressing a cDNA GFP-LC3-RFP-LC3ΔG construct were treated with 250 pM TGFβ1 for 0–48 h, lysed, subjected to SDS-PAGE and immunoblotted with anti-P-Smad2, anti-Smad2, anti-LC3B, anti-GAPDH and anti-tubulin antibodies. Quantitative analysis of steady state LC3B-II levels and the GFP/RFP ratio are shown graphically to the right of representative immunoblots. The data were graphed from three independent experiments (mean±s.e.m.). Significance is indicated as *=P<0.05, **P<0.01 and ****=P<0.0001. (B) A549 cells stably expressing a cDNA GFP-LC3-RFP-LC3ΔG construct were treated with 250 pM TGFβ1 for 6 or 24 h. Hoechst stain (blue) was added 10 min prior to imaging. Images were obtained with a 63× objective using an Olympus IX 81 inverted fluorescence microscope and ImageJ quantified the green and red pixel intensity. The GFP/RFP ratio is shown to the right of representative images. The data were graphed from three independent experiments (mean±s.e.m.). Significance is indicated as *=P<0.05. Scale bars: 10 μm.

