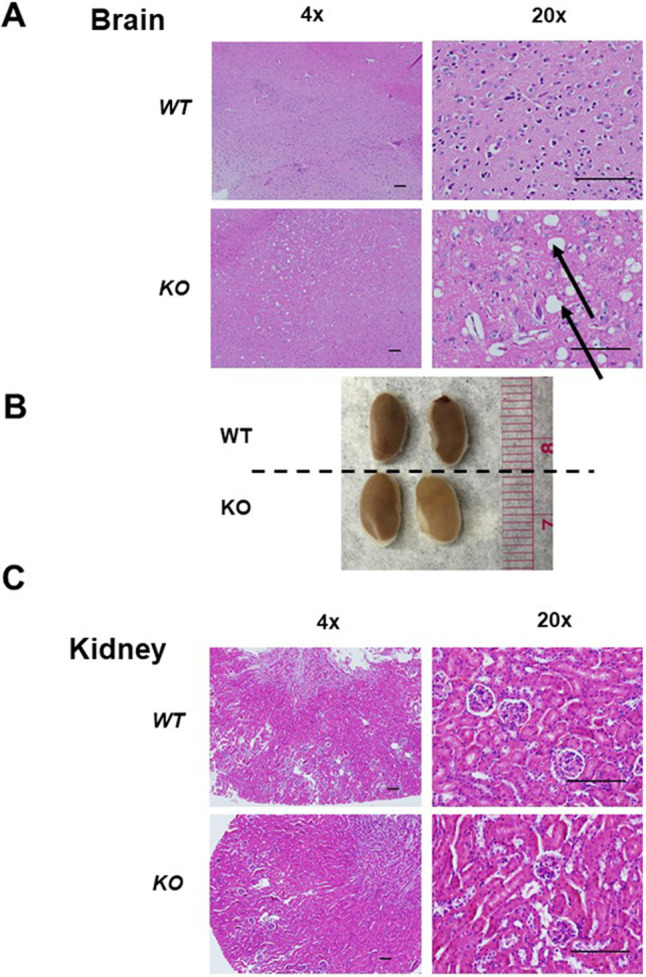
Fig. 2.

Histological analysis of L2hgdh WT (+/+) and KO (−/−) tissues. (A) Slices of mouse cerebral cortex stained with H&E. Vacuoles (indicated by black arrows) are noted in L2hgdh KO animals. (B) Gross images of kidneys from WT and KO animals. (C) Slices of mouse kidney cortex stained with H&E. Normal-appearing glomeruli and proximal tubules can be identified in both WT and KO mice. Images displayed are at 4× and 20× magnification. Scale bars: 200 μm.
