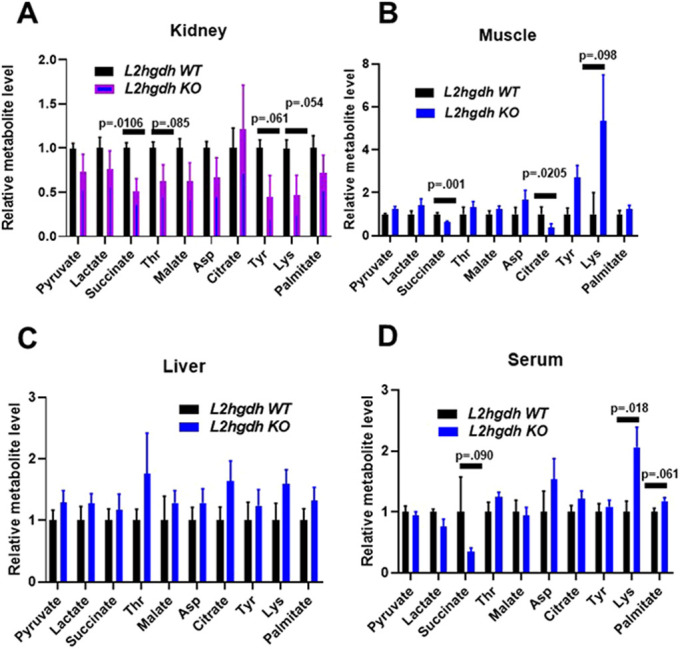
Fig. 4.

Metabolite profiling of WT and KO tissues. GC-MS metabolite profiling of tissues and serum from WT and KO mice. Mice were fasted for 12 h prior to sample harvest and metabolite extraction. Values are normalized to L2hgdh WT metabolite amount. n=5 mice for each group. Both groups contain both male and female mice. Graphs depict two-tailed unpaired Student's t-test results and data are means±s.e.m.
