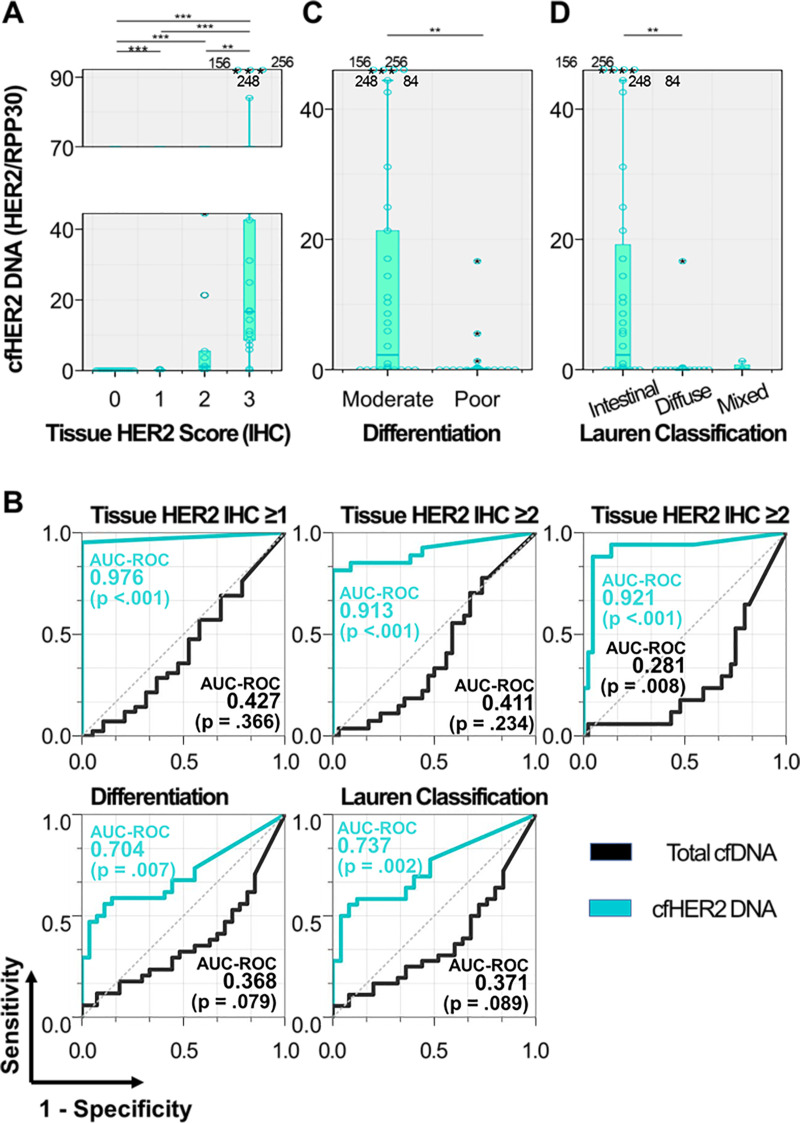
Fig 5. cfHER2 DNA detected from patients with malignant tumor.
(a) HER2 expression in cfDNA depending on the tissue HER2 score. HER2 expression (b) ROC curve analysis demonstrating the correlation of cfHER2 DNA expression with tissue HER2 score, cell differentiation, and Lauren classification. (c, d) HER2 expression in cfDNA depending on (c) cell differentiation and (d) Lauren classification.

